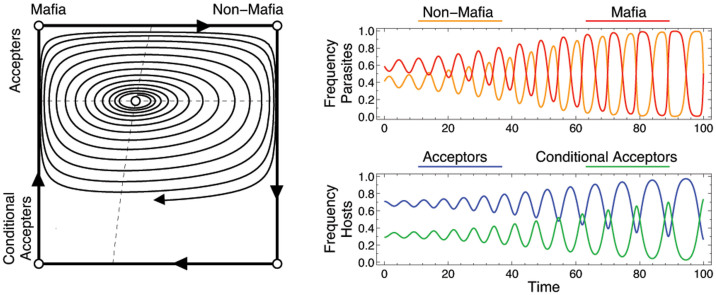
Figure 2. Evolutionary cycles in the replicator dynamics for the host-parasite interaction.
The left graph shows the state space, with the horizontal axis corresponding to the parasite frequencies (mafia behavior is frequent at the left side, and rare at the right side), whereas the vertical axis gives the host frequencies (accepters are frequent at the top, and conditional accepters at the bottom). Dashed lines show the isoclines of the system, their intersection gives the unique, but unstable equilibrium in the interior. Even if the initial population is close to the equilibrium, evolutionary orbits follow periodic cycles with increasing amplitude, as shown in the right graph (parameters bh = 5, cr = cp = cn = 1, βM = 18 and βN = 20).

