
Figure 1. The fit of random graph models to yeast PPI networks.
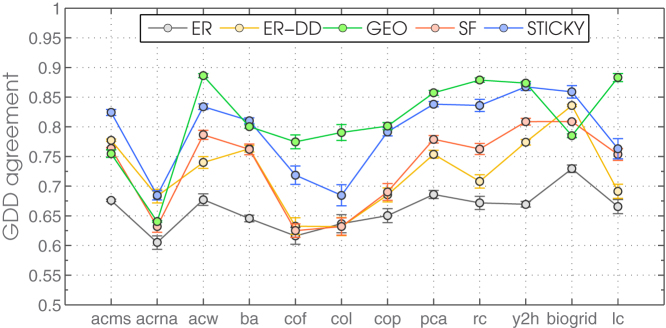
The fit of five random graph models (ER, ER-DD, GEO, SF and STICKY) to yeast PPI networks. The first 10 PPI networks listed on the x axis are extracted from BioGRID according to their evidence codes and labelled as described in the introductory section above. Label “biogrid” denotes a network comprised of all PPIs from BioGRID. Label “lc” denotes a network comprised of a literature curated set of PPIs from Reguly et al. (2006)55.