
Figure 3. Degree distributions of intra- and inter- functional proteins.
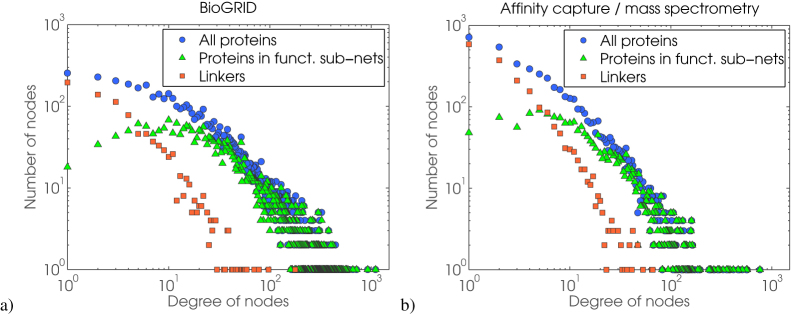
A log-log scale shows three degree distributions:  – all proteins in a network,
  – proteins in functional sub-networks (intra-functional), and
  – “linker” proteins (inter-functional). Left panel shows degree distributions for the full BioGRID network. Right panel shows degree distributions for interaction data from affinity-capture coupled with mass spectrometry. We show only two data sets here, but we've verified that all PPI screening biotechnologies (listed in the introductory section) yield the same degree distribution patterns.