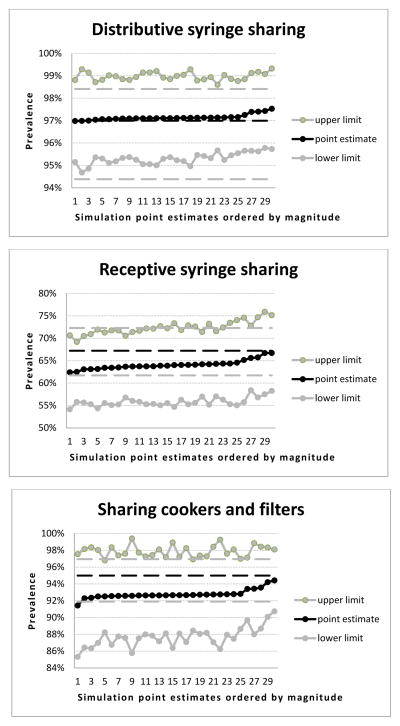
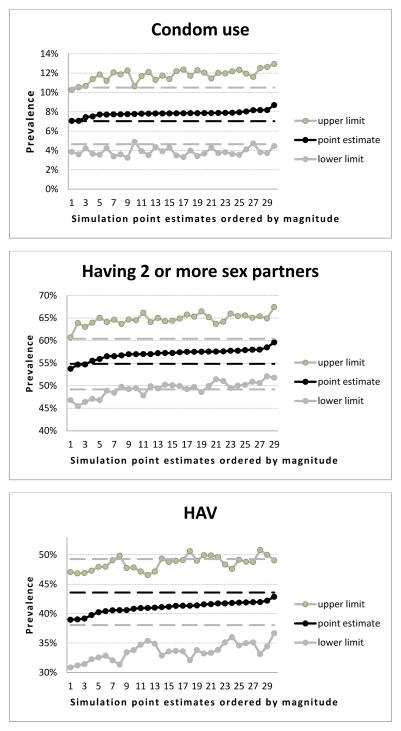
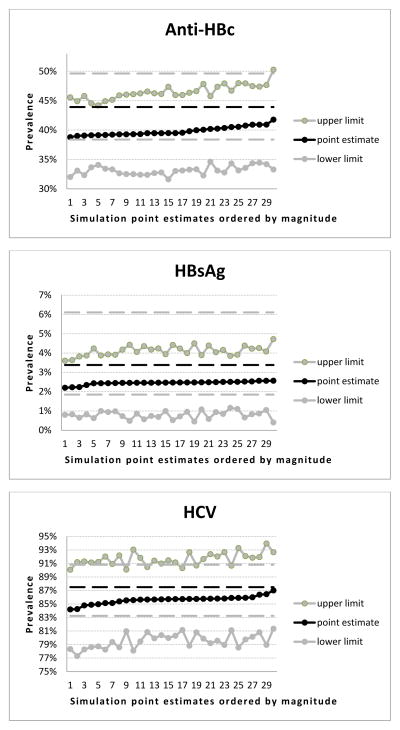
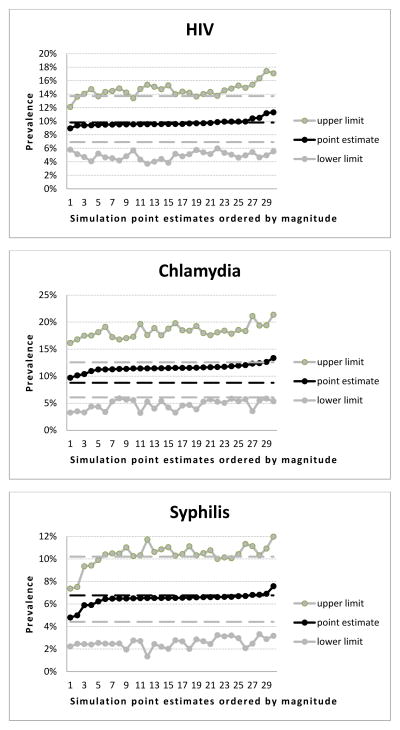
Figure 3.
Point estimates and 95% confidence intervals of the RDS simulations samples for selected infections and risk behaviours (past 30 days)
3a: Distributive syringe sharing
3b: Receptive syringe sharing
3c: Sharing cookers and filters
3d: Using condoms every time during sex
3e: Having two or more sex partners
3f: Prevalence of HAV
3g: Prevalence of anti-HBc
3h: Prevalence of HBsAg
3i: Prevalence of HCV
3j: Prevalence of HIV
3k: Prevalence of Chlamydia
3l: Prevalence of syphilis
- For better visualization and interpretation, point estimates of the simulation samples were ordered by magnitude (the X axis of each chart represents the rank order of the simulation sample point estimates), and only the related confidence interval ranges are depicted (therefore the Y axis ranges are different for each chart both in terms of minimum and maximum values and in terms of units within the ranges between minimum and maximum).
- Prevalence and, respectively, 95% confidence intervals for each characteristic in the original sample are represented as black and, respectively, gray vertical lines within each chart to provide a visual reference for the point estimates of the simulation samples.
- Statistically significant difference is when a point estimate of the simulation sample lies either under the lower confidence interval or above the upper confidence interval of the prevalence within the original sample for the relevant characteristic.


