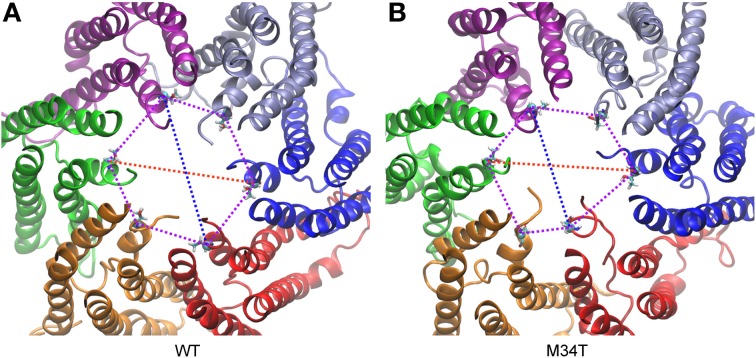
Figure 4.
Analysis of symmetry index. (A) Cx26WT connexon model. (B) Cx26M34T connexon model. Shown are the major (red) and minor (blue) diameter and the angles (purple) of the hexagon built on T5 alpha carbons for a snapshot of the equilibrium dynamics. The six connexins are rendered with different colors and represented in ribbons. Each T5 alpha carbon is represented with its Van der Waals radius, while the rest of the amino acid is represented in licorice.

