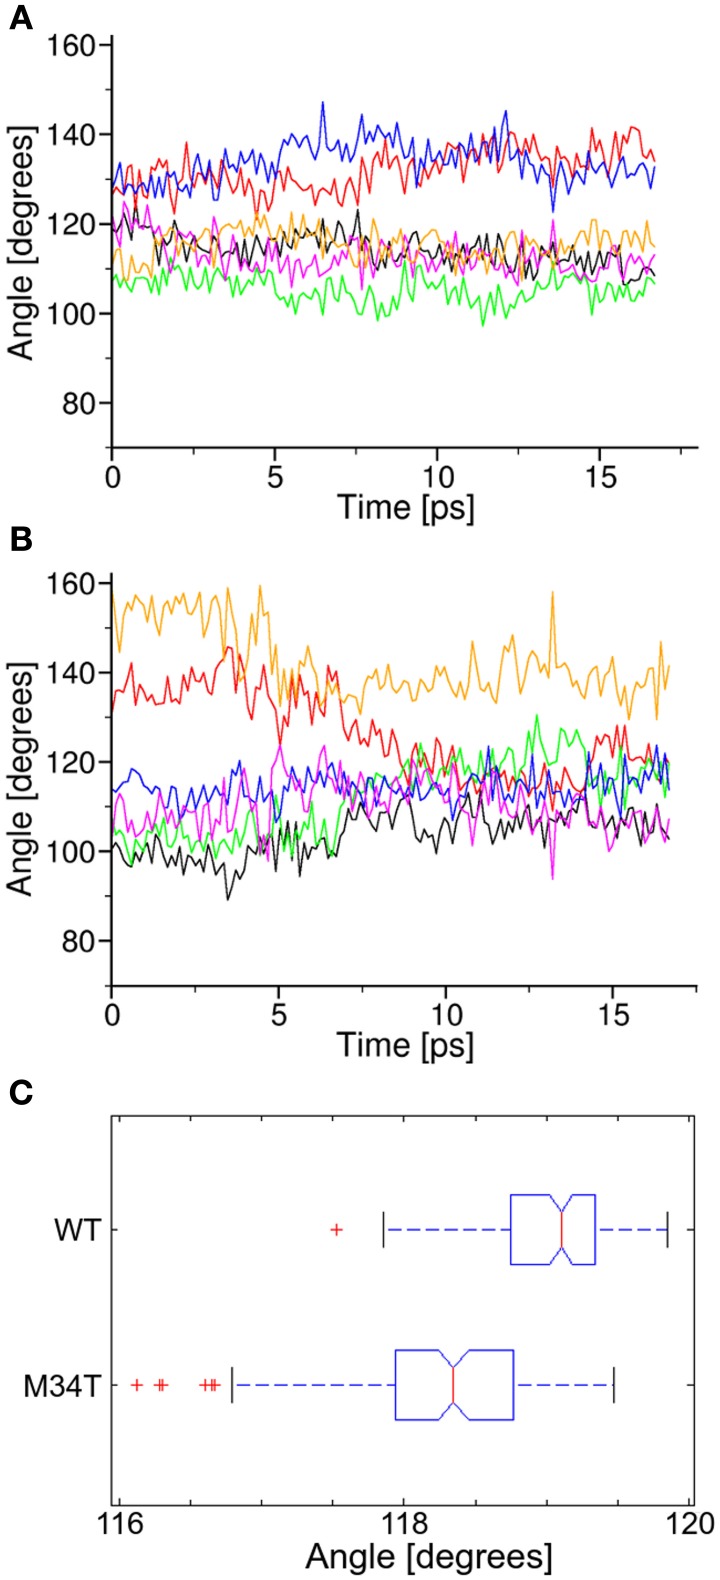
Figure 5.
Analysis of angular parameters. Panels (A,B) show the time course of angular values during equilibrium dynamics for Cx26WT and Cx26M34T, respectively (see also Figure 3). (C) Box plots of the two data distribution, in which we interpreted each angle as a representation of the corresponding observable. The difference between the two distribution is significant (see text).

