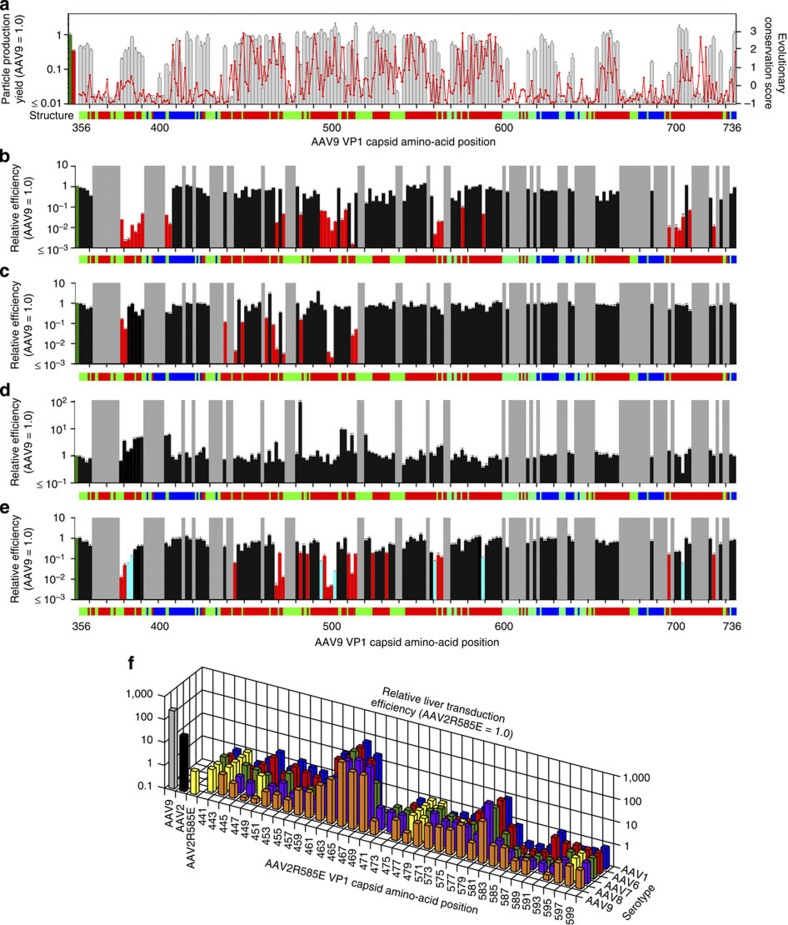
Figure 3. Results of the AAV Barcode-Seq analysis.
(a) Mapping of the AAV9 capsid amino acids important for viral particle formation. Grey bars indicate viral particle production yield in HEK293 cells determined by AAV Barcode-Seq. Evolutionary conservation scores determined by the ConSurf analysis are shown with a red line. Highly conserved amino acids show low scores. Topological locations of each amino acid are shown as a horizontal colour bar. The red, blue and green regions indicate outer surface-exposed, inner surface-exposed and buried amino acids, respectively. The far left green and red bars represent the wild-type AAV9 and AAV2R585E, respectively. (b) Liver transduction efficiency of each AAV9 AA mutant. The mutants shown with red bars are liver-detargeting mutants (>90% reduction of liver transduction efficiency). (c,d) Results of the cell surface binding assay of the AAV9 mutants using Lec2 (c) and Pro5 (d) cells. The mutants shown with red bars in c are the 14 mutants exhibiting a >80% loss of the binding ability compared with the wild type. These 14 mutants were L380A/T381A, L382A/N383A, I440A/D441A, Y446A/L447A, T450A/I451A, V465A, P468A/S469A, N470A/M471A, Q474A/G475A, Y484A/R485A, E500A/F501A, W503A, R514A/N515A and S516/L517A. (e) Transduction efficiency of the AAV9 mutants in Lec2 cells. The mutants shown with red or cyan bars are those exhibiting a >80% loss of transduction efficiency compared with the wild type. The mutants with cyan bars are the seven mutants that showed impaired postattachment viral processing deduced by a >80% reduction of the transduction-to-binding ratios. These seven mutants were D384A/G385A, S386A/Q387A, N496A/N497A, P504A/G505A, N562A/E563A, Q590A and Y706A/K707A. In b–e, the grey regions indicate the AAV9 mutants that exhibited a >95% decrease in the viral particle formation compared with the wild type and therefore are devoid of functional phenotype data; the leftmost green bars represent the wild-type AAV9. (f) Liver transduction efficiency of each AAV2R585E HP mutant. Note that yellow bars are all AAV2R585E because HP replacement in them does not change their amino-acid sequence. In all the panels, error bars represent s.e.m. The number of replicates is detailed in Supplementary Data.

