. 2014 Mar 5;3:e01440. doi: 10.7554/eLife.01440

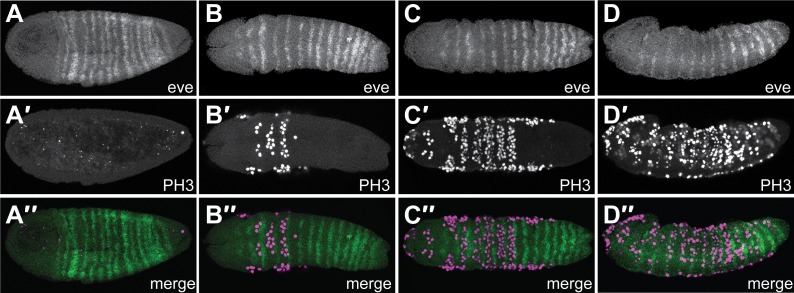
Figure 3. Nv eve expression and cell division appear to be coordinated.

Embryos co-stained for Nv eve mRNA using in situ hybridization and fluorescent detection, as well as for mitotic figures, using an antibody against phospho Histone H3. Embryos are shown with anterior left and dorsal up, except columns B and C, which are ventral views. (AA″) An early gastrula embryo exhibiting 15 stripes of Nv eve, including five derivatives of stripe 6 (A), has no evident mitotic figures in the posterior domain of Nv eve stripe 6 differentiation (A′). (A″) Merge of panels A and A′. (BD″) Timecourse series of wild-type embryos stained for Nv eve mRNA and phospho-Histone H3. (BD). Top panels are Nv eve in situ alone, middle panels (B′D′) are phospho-Histone H3 antibody staining, and bottom panels (B″D″) are merge images of upper panels, showing localization of mitotic figures relative to Nv eve stripes.

DOI: http://dx.doi.org/10.7554/eLife.01440.008

Figure 3.

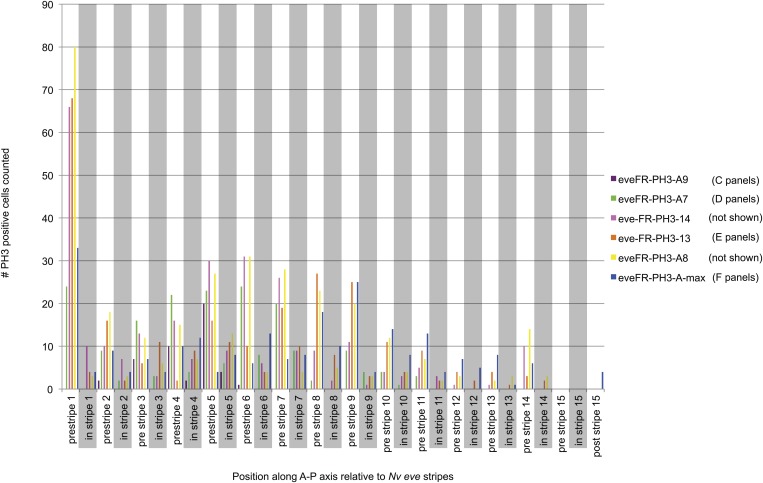
Figure 3—figure supplement 1. Quantification of PH3 positive cells relative to Nv eve stripes in the embryo.

Figure 3—figure supplement 1.

Embryos stained for phosphorylated histone H3 (to label mitotic figures) and for Nv eve mRNA (as shown in Figure 3) were analyzed to quantify the number of mitotic cells occurring between stripes as compared to within eve stripes. Cell number counted is plotted on the Y axis as a function of position along the A–P axis of the embryo (as indicated by Nv eve stripe position), which is indicated on the X axis. Mitotic cells that fall partially on a stripe are counted as occurring in the stripe. Each unique color indicates one embryo quantified in this manner, and embryos corresponding to those shown in Figure 3 are also labeled according to their position in the figure.