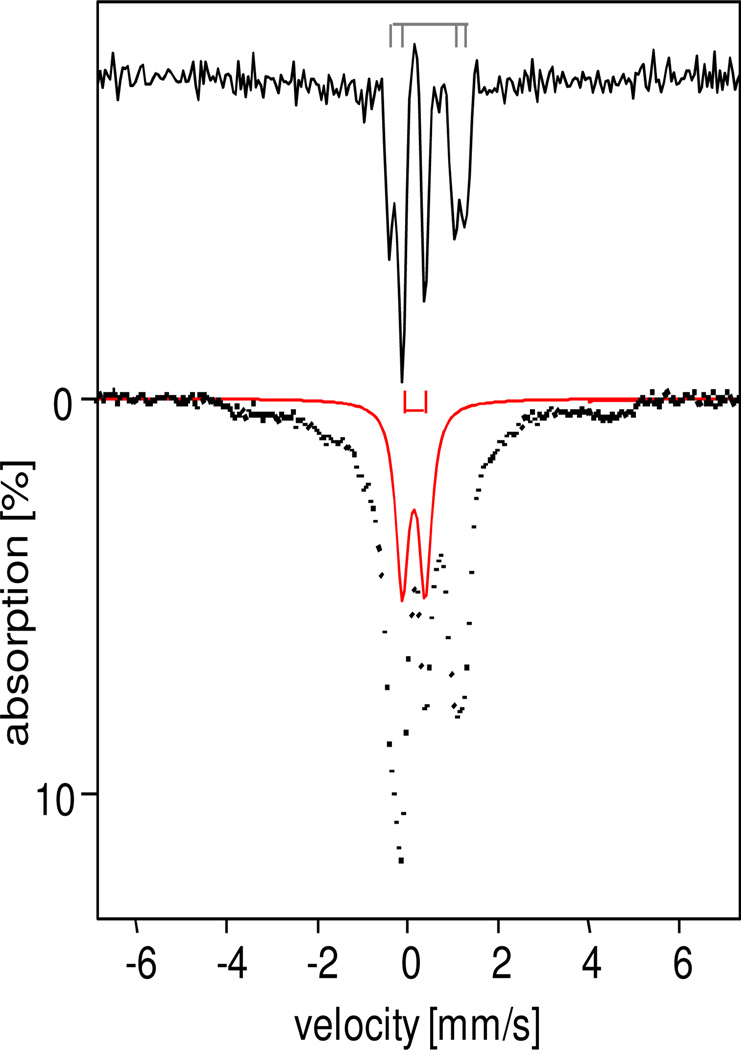
Figure 3.
4.2 K Mössbauer spectra of 6 prepared in 3:1 PrCN : MeCN (crushed EPR sample, sample a) recorded in zero field (bottom). Top spectrum was obtained by applying a Fourier transform procedure (transform, source linewidth removal, followed by a backtransform) to the spectrum at the bottom. Species 6a is indicated by the red bracket in the top panel and the red solid line in the bottom panel. Approximate composition of the sample is given in Table 4.

