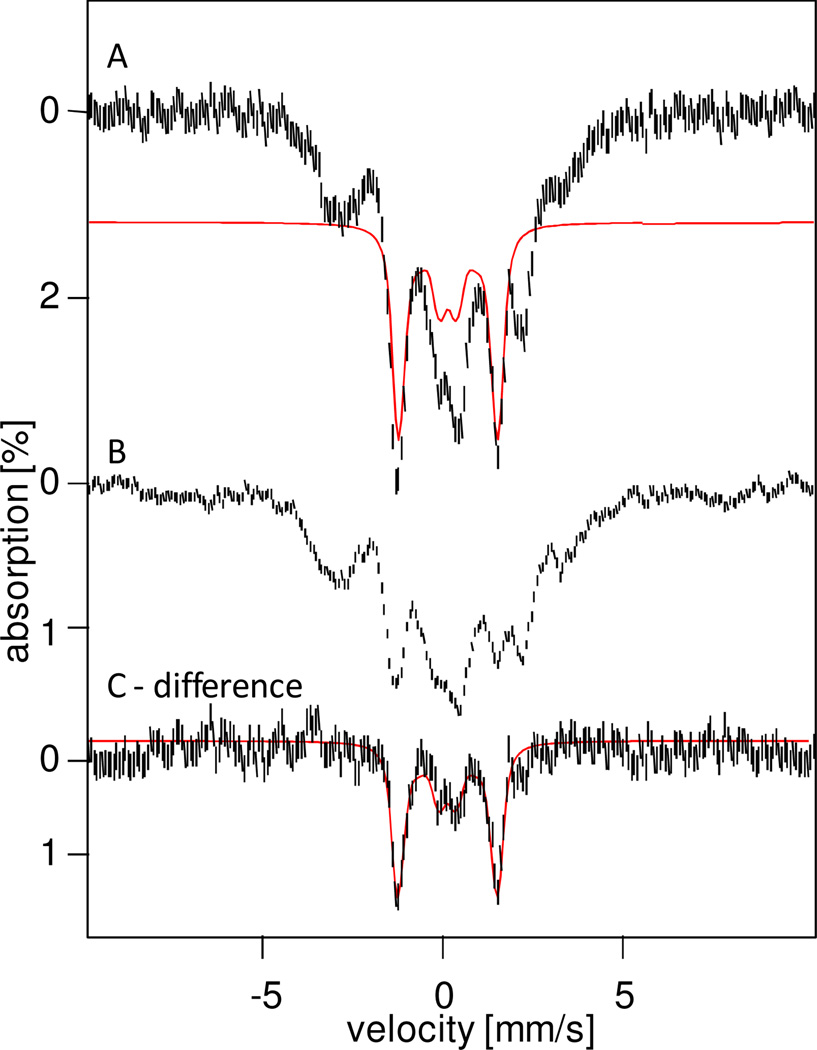
Figure 4.
4.2K, 8T Mössbauer spectra of samples c (A) and b (B). (C) Difference spectrum obtained by subtracting spectrum (B) from (A). The red lines in (A) and (C) represent spectral simulations assuming that 6a has an St = 0 ground state. See Table 1 for sample compositions and solvents.

