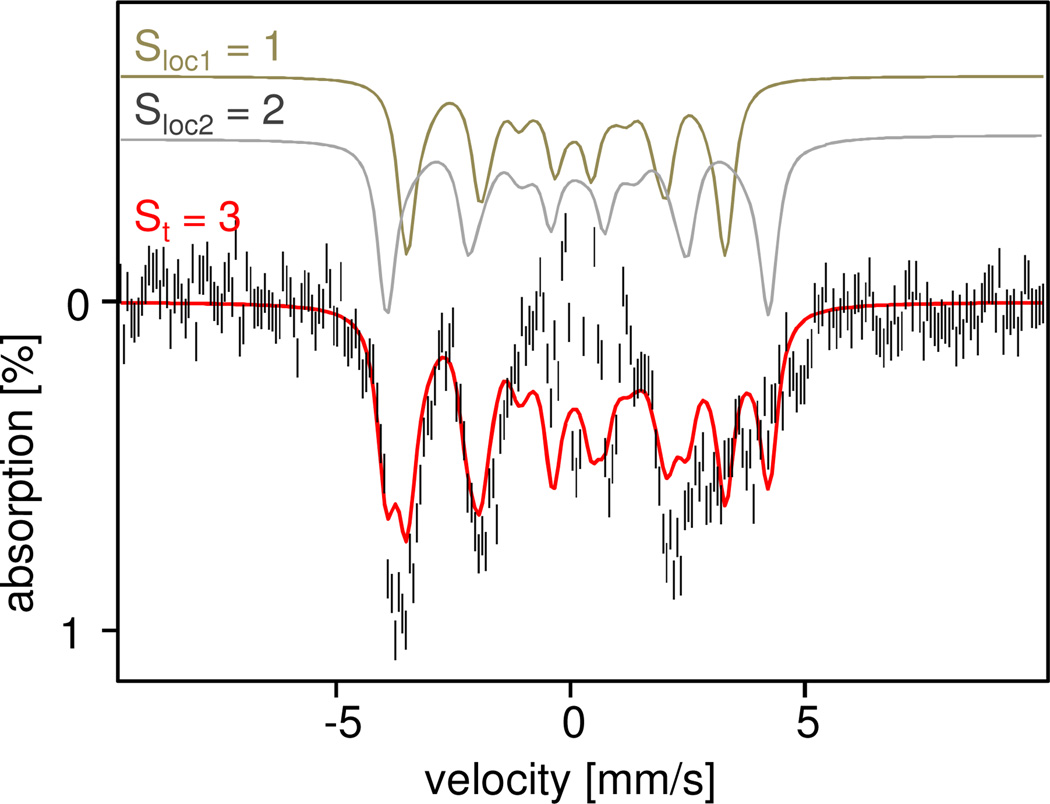
Figure 9.
4.2K, 0.5T Mössbauer spectrum of 6b (sample b) prepared as described in the text. The red line is a spectral simulation based on eqs 1 and 3. The simulated spectra for the Sloc1 = 1 and Sloc2 = 2 sites are shown above the data. The central, ±1 mm/s, region of the experimental spectrum is not well defined.

