
Figure 3. TCR and CD8 bind pMHC with fast 2D kinetics and a broad range of 2D affinities.
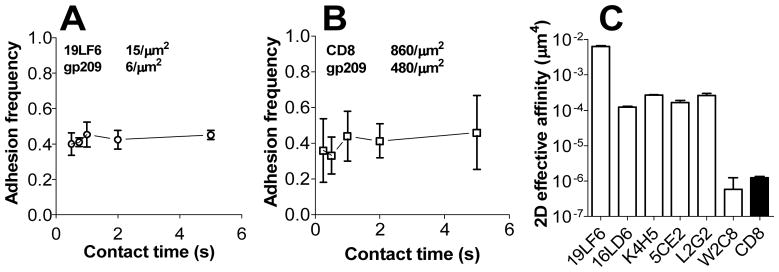
Adhesion frequency (Pa) vs. contact time plots of bimolecular TCR–pMHC (A, other TCRs are shown in Supporting Information Fig. 2A–E) or HLA-A2–CD8 (B) interactions measured by the micropipette with surface densities of TCR and pMHC indicated. Each point represents mean ± SEM (standard error of the mean) of Pa measured from 2–6 pairs of TCR+CD8− (A) or TCR−CD8+ (B) hybridomas and gp209-2M:HLA-A2 coupled RBCs. (C) 2D affinities of pMHC for a panel of TCR and CD8 calculated from the plateaued Pa according to Eq. 1 (Supporting Information Materials and Methods). Error bars represent uncertainty based on error propagation from adhesion frequency measurements.