
Figure 4. TCR and CD8 dissociate from pMHC with fast 2D off-rates.
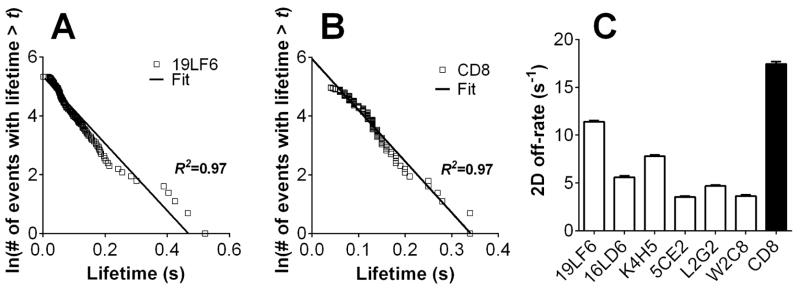
Semi-log plots of lifetime distributions of pMHC bonds with TCR (A, other TCRs are shown in Supporting Information Fig. 2F–J) or CD8 (B) measured by thermal fluctuation. The off-rate was calculated from the negative slope of linear regression. Error bars represent SEM. The high values summarized in (C) show fast dissociation kinetics.