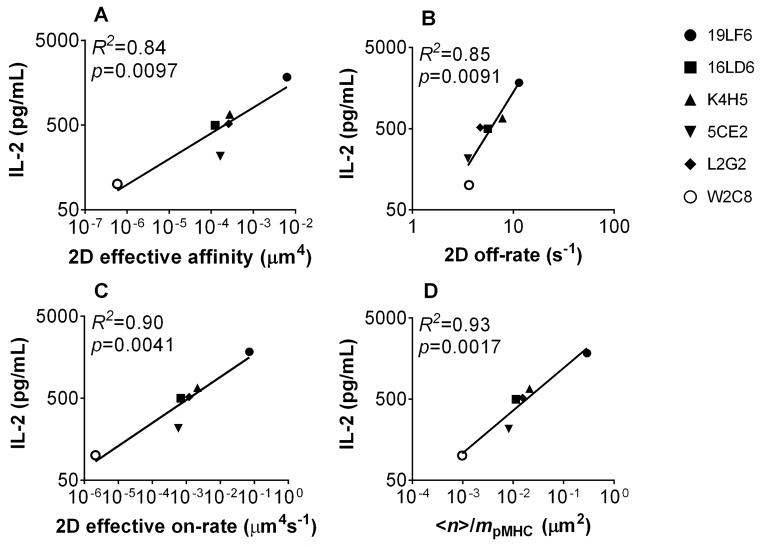
Figure 7. 2D kinetics correlates with T-cell functional responses.
IL-2 secretion for each TCR-expressing cell line was plotted against 2D effective affinity (A), off-rate (B), and effective on-rate (C) of the TCR interaction with pMHC, and <n>/mpMHC of the dual-receptor interaction with pMHC (D). The lines represent linear fits with R2 and p values indicated. In each individual panel, only IL-2 secretion at a representative peptide concentration (8 μM) is shown; comparable results were obtained if using other peptide concentrations (see Materials and methods and Supporting Information Table 1).

