Figure 6.
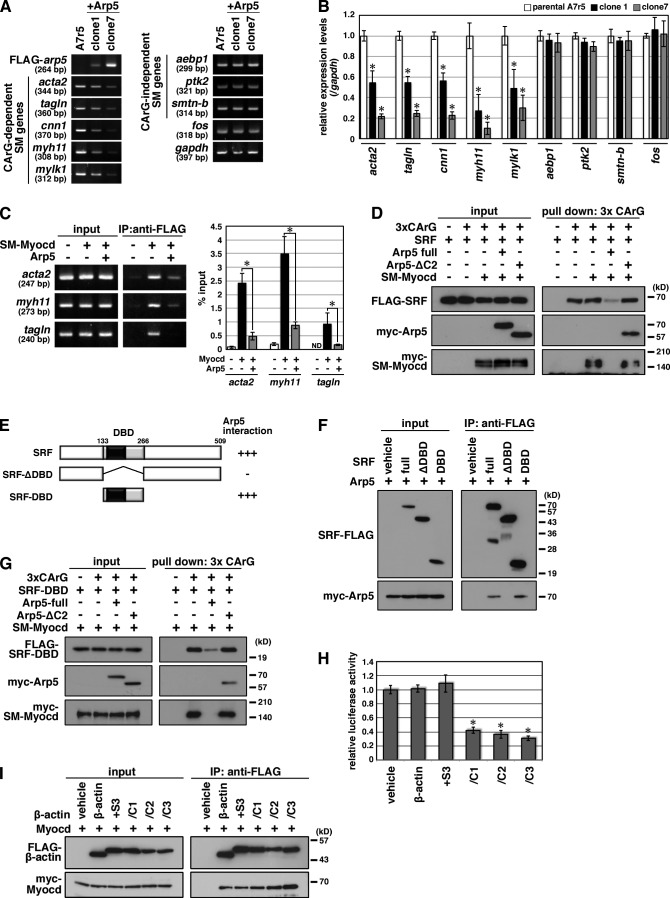
Arp5 suppresses the expression of CArG-dependent smooth muscle–specific genes. (A) Total RNA was extracted from FLAG-Arp5–expressing stable cell lines (A7r5 + Arp5, clone 1 and clone 7) and parental A7r5 cells, and RT-PCR was performed with the indicated gene-specific primer pairs. (B) Smooth muscle genes’ expression levels in A7r5 cells and A7r5 + Arp5 cell lines were quantitated by real-time RT-PCR. Data represent the mean ± SEM of three independent experiments. *, P < 0.05, Student’s t test. (C) A7r5 cells were transfected with the indicated combinations of expression vectors, after which a ChIP assay was done. Immunoprecipitated DNA was visualized by PCR using primer pairs for amplifying a part of the promoter region of acta2, myh11, or tagln (left) or quantitated by real-time PCR (righ). ND, not detected. Data represent the mean ± SEM of four independent experiments. *, P < 0.05, Student’s t test. (D) A DNA–protein binding assay was done using a biotinylated 3× CArG DNA probe. The DNA–protein complexes were pulled down using Dynabeads M-280 Streptavdin. (E) Schematic representation of the domain deletion constructs for SRF. Gray box, DBD; black box, MADS domain. Numbers indicate amino acid positions. (F) Hek293T cells were transfected with the indicated combinations of expression vectors and coimmunoprecipitation was performed. (G) A DNA–protein binding assay was performed using a biotinylated 3× CArG DNA probe. The DNA–protein complex was pulled down using Dynabeads M-280 Streptavdin. (H) The indicated expression vectors were transfected into HeLa cells with 3× CArG-Luc, and the luciferase reporter assay was performed. Data represent the mean ± SEM of four independent experiments. *, P < 0.05, Student’s t test. (I) Hek293T cells were transfected with the indicated combinations of expression vectors and coimmunoprecipitation was performed.

