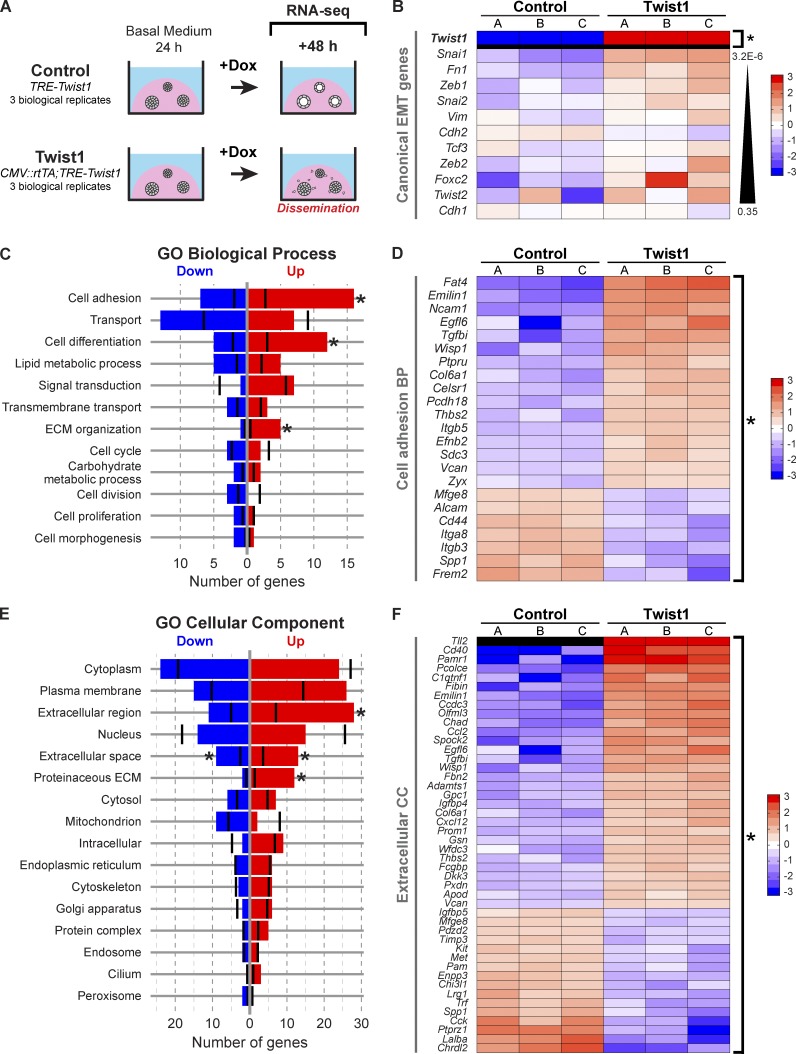
Figure 8.
Twist1 induced changes in genes regulating cell–ECM interactions and the extracellular space. (A) RNA-seq was used to compare gene expression 48 h after Twist1 induction in control versus Twist1+ organoids. (B) Heat map of canonical EMT genes. Only Twist1 was significantly differentially expressed. Genes are sorted by increasing p-value. (C–F) The 183 DE genes were mapped to direct associations with GO Slim biological process (C) and cellular component (E) terms. Black vertical bars indicate the expected number of DE genes per category. Asterisks specify significantly enriched terms. (D) DE genes associated with cell adhesion. (F) DE genes associated with extracellular space, extracellular region, and proteinaceous ECM. Genes are sorted by descending fold change in D and F. BP, biological process; CC, cellular component.

