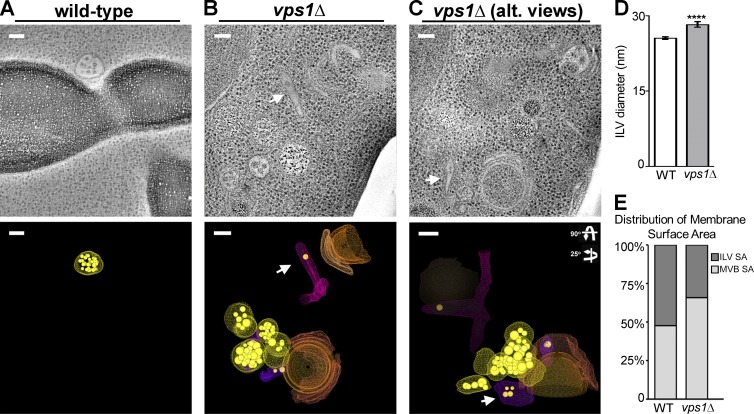
Figure 8.
Tomographic representations of vps1Δ cells reveal aberrant endosome morphology. (A and B) Multivesicular bodies observed by electron tomography (ET) are spherical (A and B, yellow models, n = 7; average diameter = 131 nm, similar to wild-type) and tubular (B and C, arrows and purple models, n = 3; average diameter, ∼50-nm diameter, variable length). Spherical MVBs observed by ET are smaller than those observed by thin-section EM quantitation. Small cisternal endosomes are also observed associated with endosomes (B and C, orange models). Tubular endosomes had fewer ILVs and were associated with other endosomes or vacuoles (B and C). (D) Intraluminal vesicle diameters from vps1Δ cells are significantly larger than wild-type (unpaired t test, P = 0.0001; wild type 25.55 nm ± 0.2307, n = 333; vps1Δ 30.65 nm ± 0.9362, n = 102). (E) Multivesicular bodies in vps1Δ cells have increased limiting membrane surface area and decreased ILV surface area compared with MVBs in wild-type cells. The distribution of endosomal membrane and internalized intraluminal vesicle membrane in wild-type and vps1Δ cells are plotted. In wild-type cells the surface areas of MVB and ILV are nearly equal (paired t test, P = 0.7434). In vps1Δ cells there is a loss in ILV surface area compared with the MVB surface area (paired t test, P = 0.0002). The mean ILV surface area generated in vps1Δ cells compared with wild-type (unpaired t test, P = 0.0049; wild-type 58924 ± 8591 nm2, n = 12; vps1Δ 27751 ± 6069 nm2, n = 20). The mean surface areas of endosomal limiting membrane of wild-type and vps1Δ cells were not significantly different (unpaired t test, P = 0.947; wild-type 57034 ± 6607 nm2, n = 12; vps1Δ 57690 ± 6459 nm2, n = 20).

