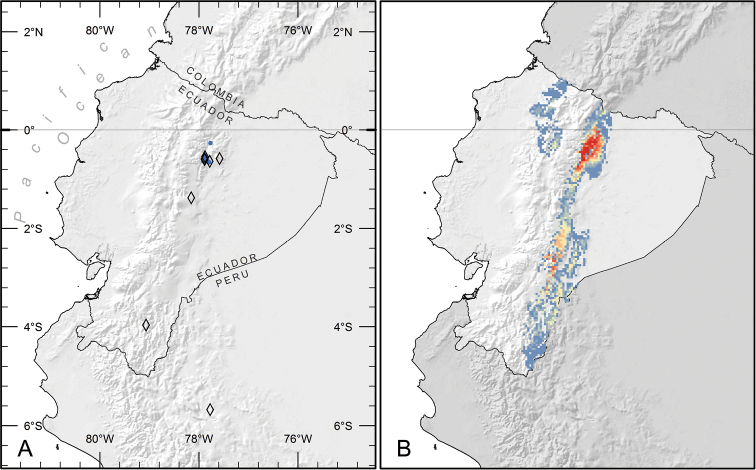
Figure 3.
Distribution of Piper kelleyi. A Distribution of known localities based on collections (open diamonds) and study plots used to gather natural history data (blue circles) B Predicted distribution based on analysis of habitat parameters using the maximum entropy method. Areas in red are the most likely to have suitable habitat for Piper kelleyi (probability = 0.75–0.87), and areas in blue (0.02–0.08) or unlabeled (< 0.02) are the least likely.

