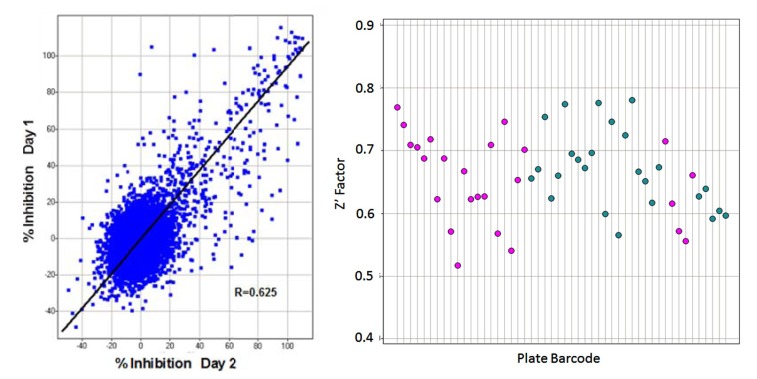
Fig. (7).
Assay Qualification. Left: Correlation plot in Spotfire from % inhibition of autophagy on Day 1 vs. Day 2 of the Validation Screen. From 8,000 compounds (25 plates) screened and setting a threshold of >30% inhibition of the positive control, the hit rate on Day 1 was 3.0% vs. 3.2% on Day 2. Confirmation of positive compounds between Day 1 and 2 averaged 69%. Right: Z’ for control wells of individual plates (n=16 for each control, every plate) run for assay validation on Day 1 (pink) and 2 (blue). All plates were >0.5, with the Mean Z’ being 0.66. These Z’ were predictive of the HTS assay itself, indicating a robust assay. Where Z’ <0.5, the plate was repeated.

