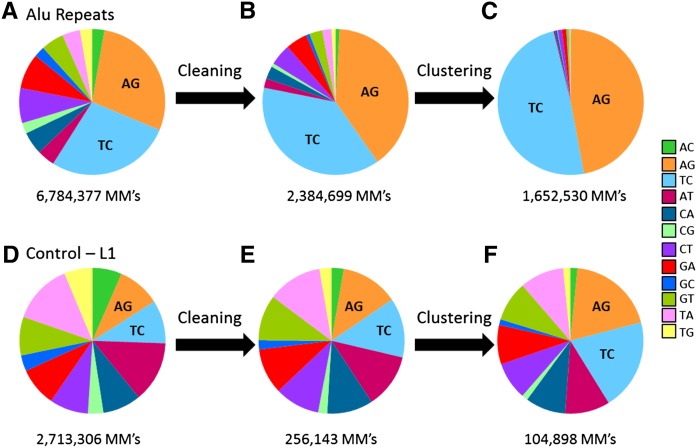
Figure 2.
Mismatch distributions along the detection pipeline. (A) Even a simple count of all mismatches in high-quality base pairs of sequencing reads data of Alu repeats shows a significant enrichment of editing-derived mismatch types (AG and TC). (B) Applying a strict statistical model to filter out probable sequencing errors further increases the fraction of AG/TC mismatches, but results in the loss of most of the estimated true editing signal as well. (C) In this study, we focused on the full Alu repeats rather than single genomic sites. This improves the statistical power, with only a minor reduction in the signal. As a result, we found that virtually all Alu repeats are dominated by AG/TC mismatches. (D–F) The same pipeline applied to mismatches located in the common L1 retroelement. Clearly, the strong propensity for A-to-I RNA editing is unique to the Alu repeat. However, some enrichment of AG/TC mismatches is nevertheless observed, attesting to some editing activity in the L1 repeats.

