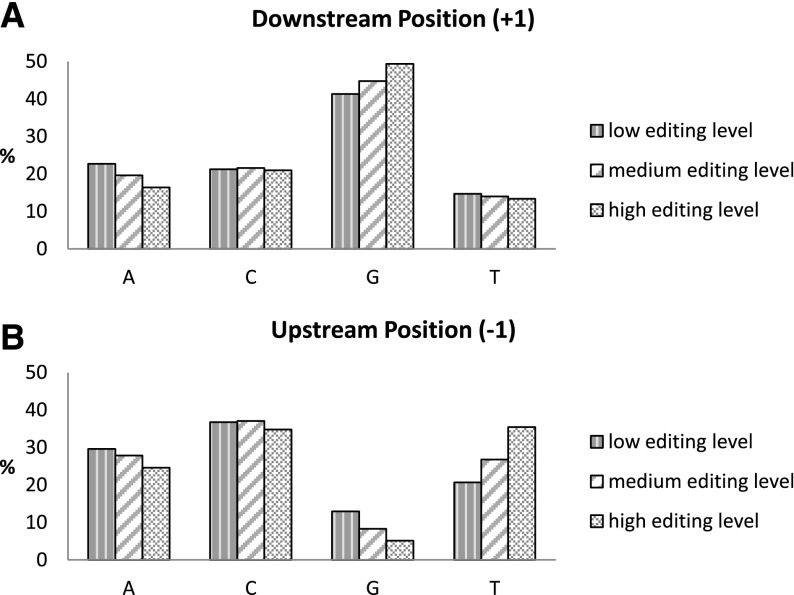
Figure 3.
Distribution of downstream (A) and upstream (B) nucleotides for editing sites detected in the HBM data sets. Edited sites are split into three groups according to their editing level: low level ≤10%, high level ≥40%, and medium level >10% and <40%. A clear signature of the ADAR sequence preference is observed (low G upstream of the site, and some enrichment downstream from the site). The preference is stronger at sites with high editing levels.

