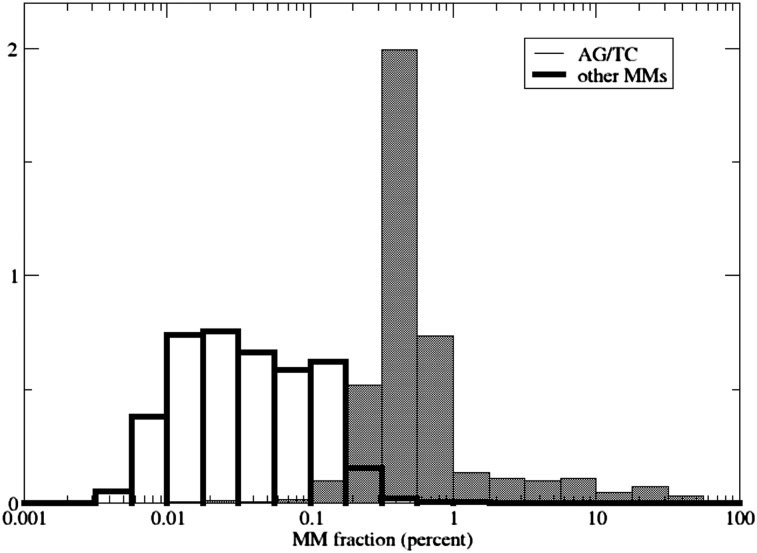
Figure 7.
Mismatch fraction distribution. Even before applying any statistical filters or analysis, a marked distinction is evident between AG/TC mismatches and other types of mismatches, provided there is sufficiently deep coverage. Presented are the distributions of the mismatch fractions (percent of reads that exhibit the mismatch among all reads supporting the site) for all (high quality, Q ≥ 30) mismatches seen in our MiSeq experiment at sites with high coverage (≥5000 reads, allowing for an accurate assessment of the mismatch fraction). Most mismatches are likely to result from sequencing errors and occur at fractions <0.1%, consistent with the sequencing quality. The AG/TC mismatches span a different range of mismatch fractions, where the bulk of the distribution lies in the range 0.1%–1%, but some sites are edited with stronger efficiencies, up to those showing close to 100% editing in a few sites. This separation of scales allows identification of editing sites, provided an accurate assessment of the mismatch fraction (requiring ultradeep coverage) is available. MM, mismatch. The y-axis shows the normalized probability density P(−log[MM fraction]).

