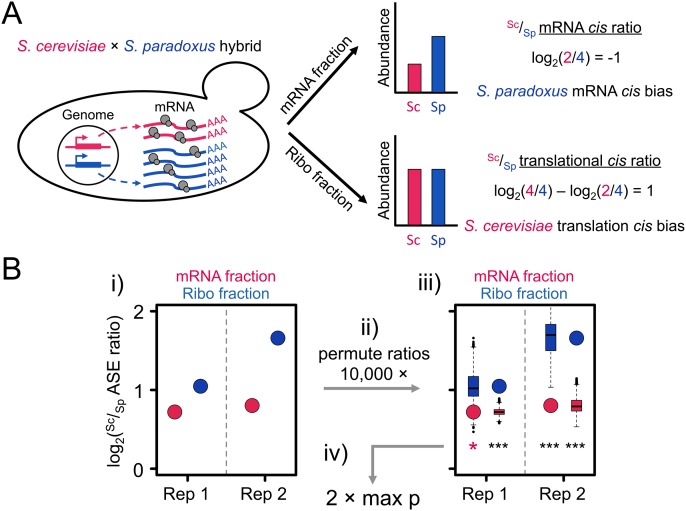
Figure 1.
(A) Identifying cis-regulatory divergence at two levels. In the example, the S. paradoxus allele (blue) is transcribed at a higher level than that of S. cerevisiae (red), as represented by the larger number of wavy lines. However, the S. cerevisiae allele has higher translational efficiency, as represented by the larger number of ribosomes per transcript (pairs of gray circles). The S. paradoxus mRNA cis bias manifests as a negative log2(Sc/Sp) ratio in the mRNA fraction. If translational efficiency was unchanged between alleles, the more abundant allele, in this case S. paradoxus, would produce more footprints in the Ribo fraction. Therefore the translational cis ratio is obtained by dividing the Sc/Sp Ribo fraction ratio by the mRNA fraction ratio (which is equivalent to a subtraction in log2). The net log2(Sc/Sp) translational cis ratio is positive, indicating cis bias favoring S. cerevisiae translation. (B) Detection of significant translational divergence is based on rejecting the null hypothesis that the observed allelic ratios are not significantly different from one another (see A). The observed Sc/Sp ratios (red circles, mRNA fraction; blue circles, Ribo fraction) (i) were obtained directly from the replicates of the two fractions. (ii) These were permuted by resampling the base-level coverage of each allele with replacement 10,000 times, generating a distribution of Sc/Sp ratios that captures the interallelic variability in base composition, length, and read coverage. (iii) The distributions of permuted ratios (boxplots) were then each reciprocally compared with the corresponding observed ratio (e.g., the permuted distribution of Sc/Sp Ribo ratios [blue boxplots] was compared with the observed mRNA Sc/Sp ratio [red circles] and vice versa) for which a two-tailed P-value was calculated. If all comparisons agreed in the parental direction of allelic bias, then (iv) the least significant P-value (indicated by the red asterisk) was used as the representative for the comparison. See Supplemental Material for application of the test to the mRNA level and trans comparisons.

