
Figure 1.
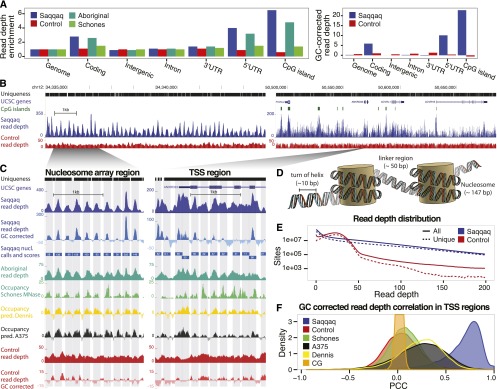
Paleo-Eskimo read depth reflects nucleosome occupancy. (A, left) Regional variation in read depth relative to genomic average (enrichment) for Saqqaq, Control, Aboriginal, and an experimental occupancy map (‘Schones’) (Schones et al. 2008). (Right) Saqqaq and Control regional read-depth variation after GC-correction. (B) Read-depth variation in a centromeric region known to harbor a 200-kb array of well-positioned nucleosomes (Gaffney et al. 2012) (left) and a region with genes (right). CpG islands (green bars) correlate with elevated read depth in the Saqqaq. The variation is also observed in genomically unique regions (black bars), where reads down to length 25 can map. The read depth of the Control exhibits lower variance. (C) Examples of Saqqaq read-depth variation, GC corrected read-depth variation, Saqqaq nucleosome predictions, and experimental (Schones, from CD4+ cells) as well as computational (Dennis and A375) (Dennis et al. 2007; Ozsolak et al. 2007) occupancy maps in ∼2-kb regions of the nucleosome array (left) and a transcription start site (TSS) region (right). Light gray denotes the 147-bp-long nucleosome predictions. Saqqaq read depth correlates with both the read depth of the ancient Aboriginal genome and the occupancy maps, but not with the Control. (D) DNA packaged around nucleosomes. We hypothesize that DNA wound around nucleosomes to be better protected from degradation. (E) The Saqqaq shows more variation in read depth than Control, with more genomic sites showing extremely low or high read depth. (F) Distribution of correlations for Saqqaq versus other sets across all promoter regions.