Figure 6.
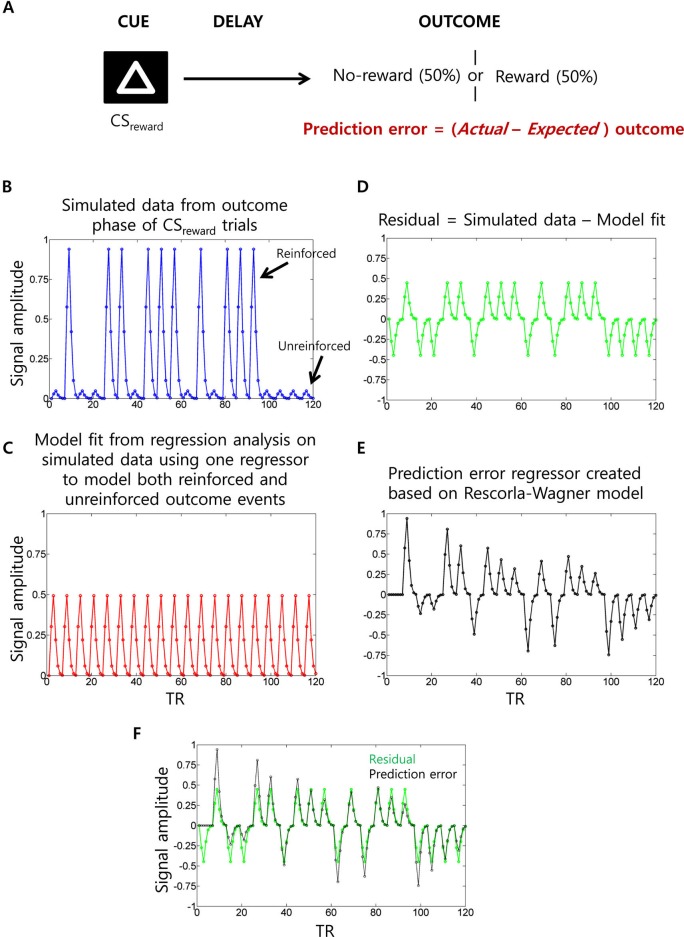
Prediction error (PE) signal analysis and potential confounds in fMRI analysis. (A) In a typical appetitive Pavlovian conditioning paradigm, one visual cue (CSneutral; not shown) is associated with no-reward (100% probability) whereas a second visual cue (CSreward) is associated with 50% probability of receiving reward. PE (i.e., actual minus expected outcomes) measured at the outcome phase of CSreward trials. (B) Simulated fMRI time series data (blue) generated using 10 reinforced and 10 unreinforced outcome events of CSreward trials in a pseudorandom order with 15 s separation between events at a typical TR of 2.5 s. For the sake of simplicity, we have not considered CSneutral trials and the cue phase of CSreward trials (which are typically modeled as separate regressors) and no noise was added to the simulated data. (C) When a single outcome phase regressor is used to account for variance during both reinforced and unreinforced outcomes of CSreward trials as typically done, the estimated regression coefficient would be somewhere midway between the activity evoked by reinforced and unreinforced outcomes, as demonstrated by the estimated data fit (red). (D) Hence, the residual time series data (green) will show positive values during reinforced outcome events and negative values during unreinforced outcome events. (E) Parametric regressor based on trial-by-trial fluctuations of PE values at the outcome phase of CSreward trials calculated using the Rescorla-Wagner rule (Rescorla and Wagner, 1972) (a learning rate of 0.25 was used as often used in fMRI studies). (F) The residual time series and the PE regressors are overlaid to show the high correlation between them. Because of this, unaccounted variance during the outcome phase related activity of CSreward trials could be “spuriously” accounted by the PE regressor.

