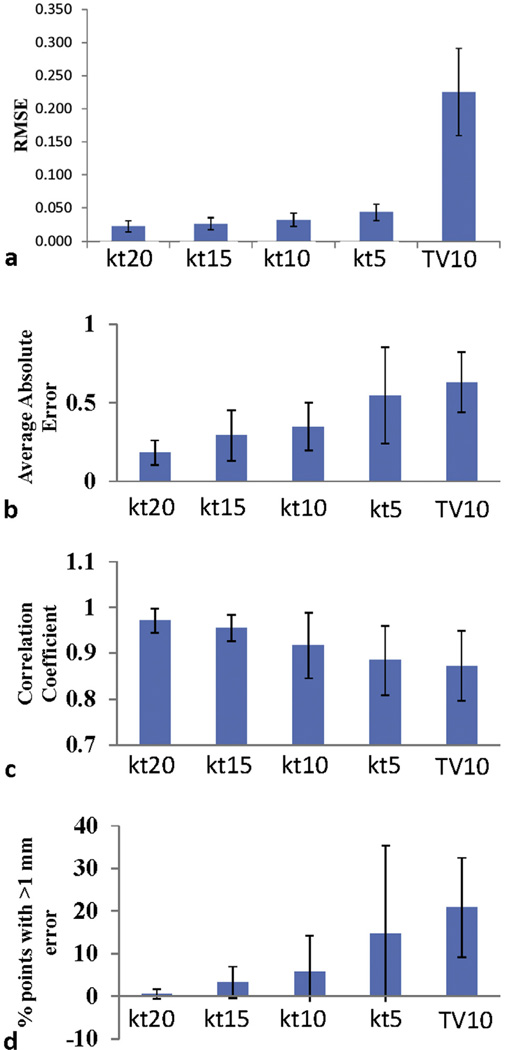
Fig. 5.
(a) Mean normalized mean square errors value of the reconstructed images. “kt” and “tv” denote recovery methods of k-t SLR and total variaion reconstruction of individual frames, respectively. The numbers following kt and cs denote undersampling ratios (%). (b) Correlation between the tumor motion for the fully sampled data and reconstructed data. (c) Average absolute tracking errors. (d) The percentage of tracking points with >1 mm error. All values were computed on the basis of the total tumor .

