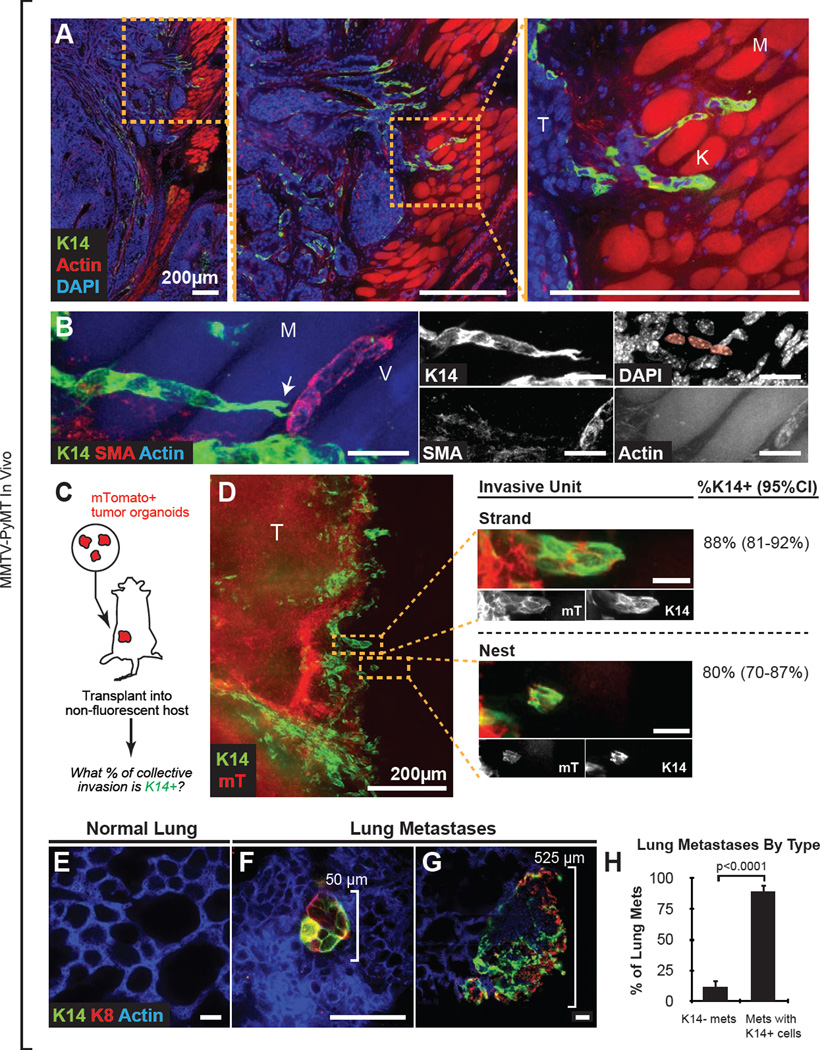
Figure 2. K14+ Cells are Enriched at the Tumor Invasive Border and in Lung Metastases.
(A) Area of tumor invasion into muscle in 100-µm thick mammary tumor sections, stained with K14, DAPI, and phalloidin. T, tumor; K, K14+ leader cells; M, phalloidin+ muscle fibers.
(B) Collectively invading K14+ leaders at high magnification stained with K14, phalloidin, SMA, and DAPI. M, muscle; V, SMA+ vessel; arrow, leading K14+ cell with forked protrusions. Inset highlights the chain of three K14+ cells. This micrograph represents a z-projection of over 40 µm to capture the organization of the invasive strand. See Movie S2.
(C) Schema to quantify the percentage of collective invasion that is led by K14+ cells. mTomato+ tumor organoids were isolated from MMTV-PyMT;mT/mG mice. Organoids were transplanted orthotopically into non-fluorescent congenic hosts. Transplanted tumors >1cm in size were harvested to generate montages of the tumor-stromal border.
(D) Micrograph of a representative mTomato+ tumor-stromal border stained with K14. mTomato+ regions (in red) denote tumor-derived cells. Insets denote multicellular groups of cells invading into the adjacent stroma. An invasive strand was defined as a protrusive group of cells connected to the main tumor. A nest was defined as an isolated group of tumor cells. N=145 invasive strands and N=83 nests were counted from 13 sections from 5 mice. 95% confidence intervals denoted in parentheses. The micrograph represents a 40 µm z-projection.
(E–G) Reconstructed metastases in thick sections of lungs from MMTV-PyMT mice, stained with K14, K8, and phalloidin. Normal lung parenchyma was K14 negative (E). Both micro-metastatic and larger metastatic lesions had K14+ and K8+ cells (F–G).
(H) Metastatic lung lesions were identified by K8 positivity and classified based on their K14 status. Data are presented as mean ± sd. n=226 metastases, from 5 tumor mice. P-value determined by two-sided t-test.
Scale bars are 20 µm in (B,D) and 50 µm in (E–G). See also Figure S2.

