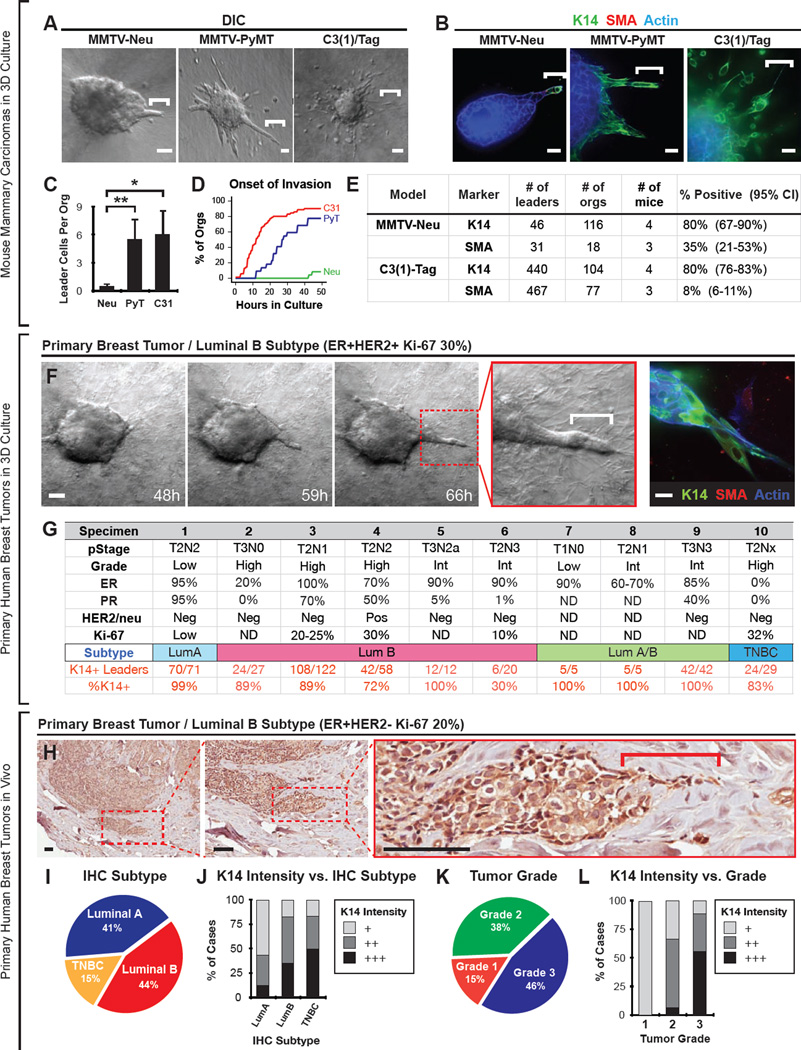
Figure 3. K14+ Cells Lead Collective Invasion Across Mouse Models of Breast Cancer and in Primary Human Breast Cancers.
(A) Time-lapse DIC microscopy of collagen I embedded organoids derived from MMTV-Neu, MMTV-PyMT, or C3(1)/Tag mammary tumors. White bars, leader cells. Also see Movie S3.
(B) Micrographs of leader cells from the three mouse models in (A) stained with K14, SMA, and phalloidin.
(C) Quantification of the number of invasive leaders per tumor organoid in (A). For MMTV-Neu, N=116 organoids from 4 mice. For MMTV-PyMT, N=245 organoids from 10 mice. For C3(1)/Tag, N=104 organoids from 4 mice. Data are presented as mean ± sd. *, P-value < 0.05. **, P-value < 0.01. P-value determined by two-sided t-test.
(D) The percentage of invasive tumor organoids from the three mouse models in (A) as a function of time in culture (in hrs). Onset of invasion was defined as the first instance of protrusive cell motility into collagen I matrix. N=22–70 tumor organoids per mouse model.
(E) Frequency of leader cells expressing K14 or SMA in MMTV-Neu or C3(1)/Tag tumor organoids. 95% confidence intervals for each proportion denoted in parentheses.
(F) Time-lapse DIC microscopy of a human luminal breast tumor organoid embedded in collagen I matrix (sample S4). White bar, leader cell. At right, micrograph of tumor organoid from same tumor specimen, stained for K14, SMA, and F-actin. Also see Movie S3.
(G) Pathologic characteristics of harvested human breast tumors, including stage, grade, ER status, PR status, HER2/Neu status, Ki-67 percentage, and the measured frequency of K14+ leaders. 9 of 10 tumors were ER positive luminal breast tumors, with ER positivity ranging from 20–100%. The breast cancer subtype was determined using surrogate immunohistochemistry definitions (Goldhirsch et al., 2013).
(H) Representative micrograph of a K14+ collective invasion front from an archival specimen classified as luminal B.
(I) The distribution of cases according to breast cancer subtype assigned using surrogate IHC subtype definitions. N=39 cases in total.
(J) The frequency of cases with low (+), medium (++), or high (+++) K14 staining stratified by IHC-defined breast cancer subtype. K14 intensity was scored as in Figure S4A.
(K) The distribution of cases according to histologic tumor grade.
(L) The frequency of cases with low (+), medium (++), or high (+++) K14 staining stratified by tumor grade.
Scale bar represents 50 µm in (A,F: left movie series), 20 µm in (B,F: right panel), and 100 µm in H. See also Figures S3 and S4.

