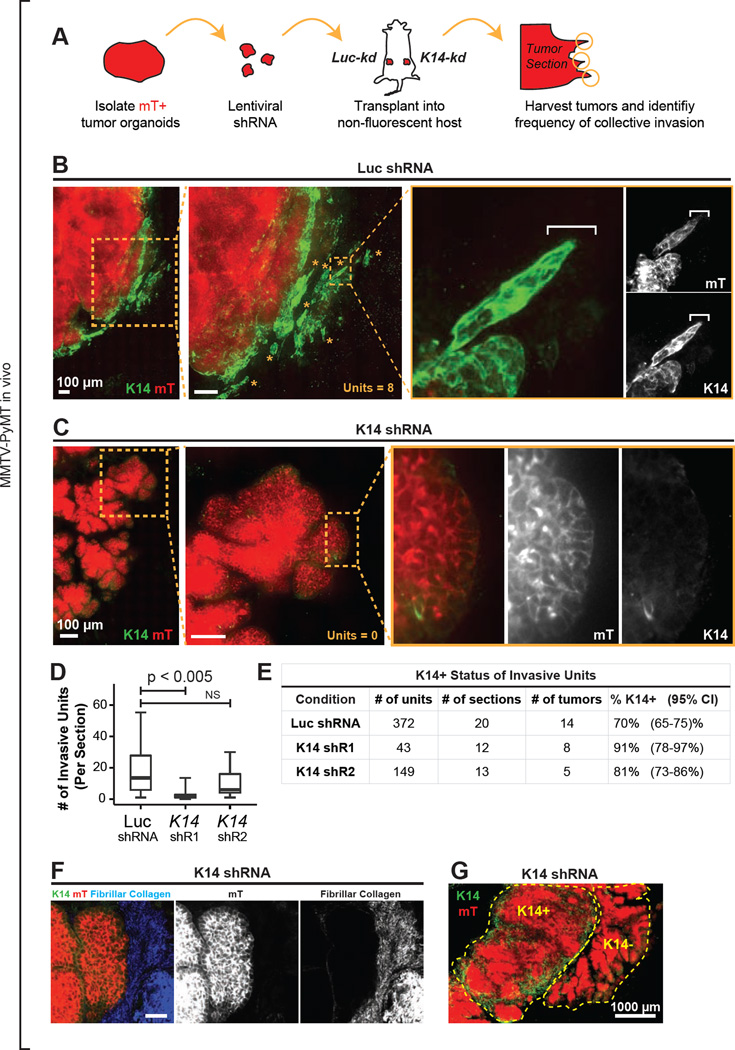
Figure 7. In Vivo Knockdown of K14 Disrupts Collective Invasion at the Tumor-Stromal Border.
(A) Schema to test the in vivo requirement for K14 in collective invasion. Fluorescent mTomato+ (mT+) tumor organoids were transduced with either Luc shRNA (Luc-kd) or K14-shRNA (K14-kd), selected with puromycin, and transplanted into the cleared mammary fat pads of non-fluorescent congenic FVB hosts. Tumor was isolated at ~1cm and montages were assembled of the tumor-stromal border.
(B) Micrograph of the tumor-stromal border from a representative Luc-kd tumor stained with K14. mT+ regions (in red), tumor-derived cells. Insets, collective invasive units in the Luc-kd tumor. The micrograph represents a z-projection of over 40 µm.
(C) Micrograph of the tumor-stromal border from a representative K14-kd1 tumor stained with K14. mT+ regions (in red), tumor-derived cells. Insets, representative K14- non-invasive border.
(D) Median number of invasive units per section in Luc-kd and K14-kd tumors, with data presented as a boxplot. Invasive units included strands and nests as described in Figure 2E. P-values determined by 2-sided t-test.
(E) Frequency of invasive units expressing K14 in Luc-kd and K14-kd tumor sections. 95% confidence intervals for each proportion denoted in parentheses.
(F) Representative micrograph of K14-kd1 tumor stromal border stained for K14 and assayed for fibrillar collagen by SHG. mT+ regions (in red), tumor-derived cells.
(G) Micrograph of a K14-kd1 tumor stained with K14, demonstrating K14+ and K14-tumor foci. The micrograph represents a z-projection of over 40 µm. Scale bars represent 100 µm in (B–C), 40 µm in (F) and 1000 µm in (G).

