
Figure 4.
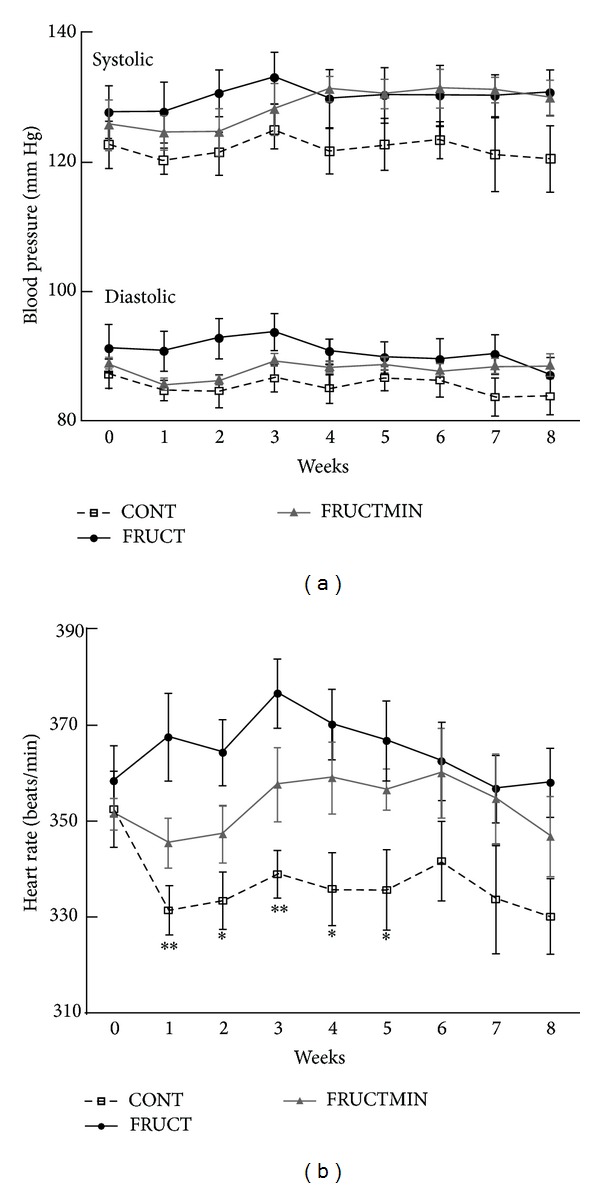
(a) Systolic blood pressure (mm Hg; n = 4–7) and diastolic blood pressure (mm Hg; n = 4–7), and (b) heart rate evolution (beats/min; n = 4–7; *P < 0.05 CONT versus FRUCT; **P < 0.01 CONT versus FRUCT), during the dietary intervention. Results were expressed as mean ± standard error of the mean. CONT: control; FRUCT: 10% fructose in tap water; FRUCTMIN: 10% fructose in natural mineral-rich water.