
Figure 7.
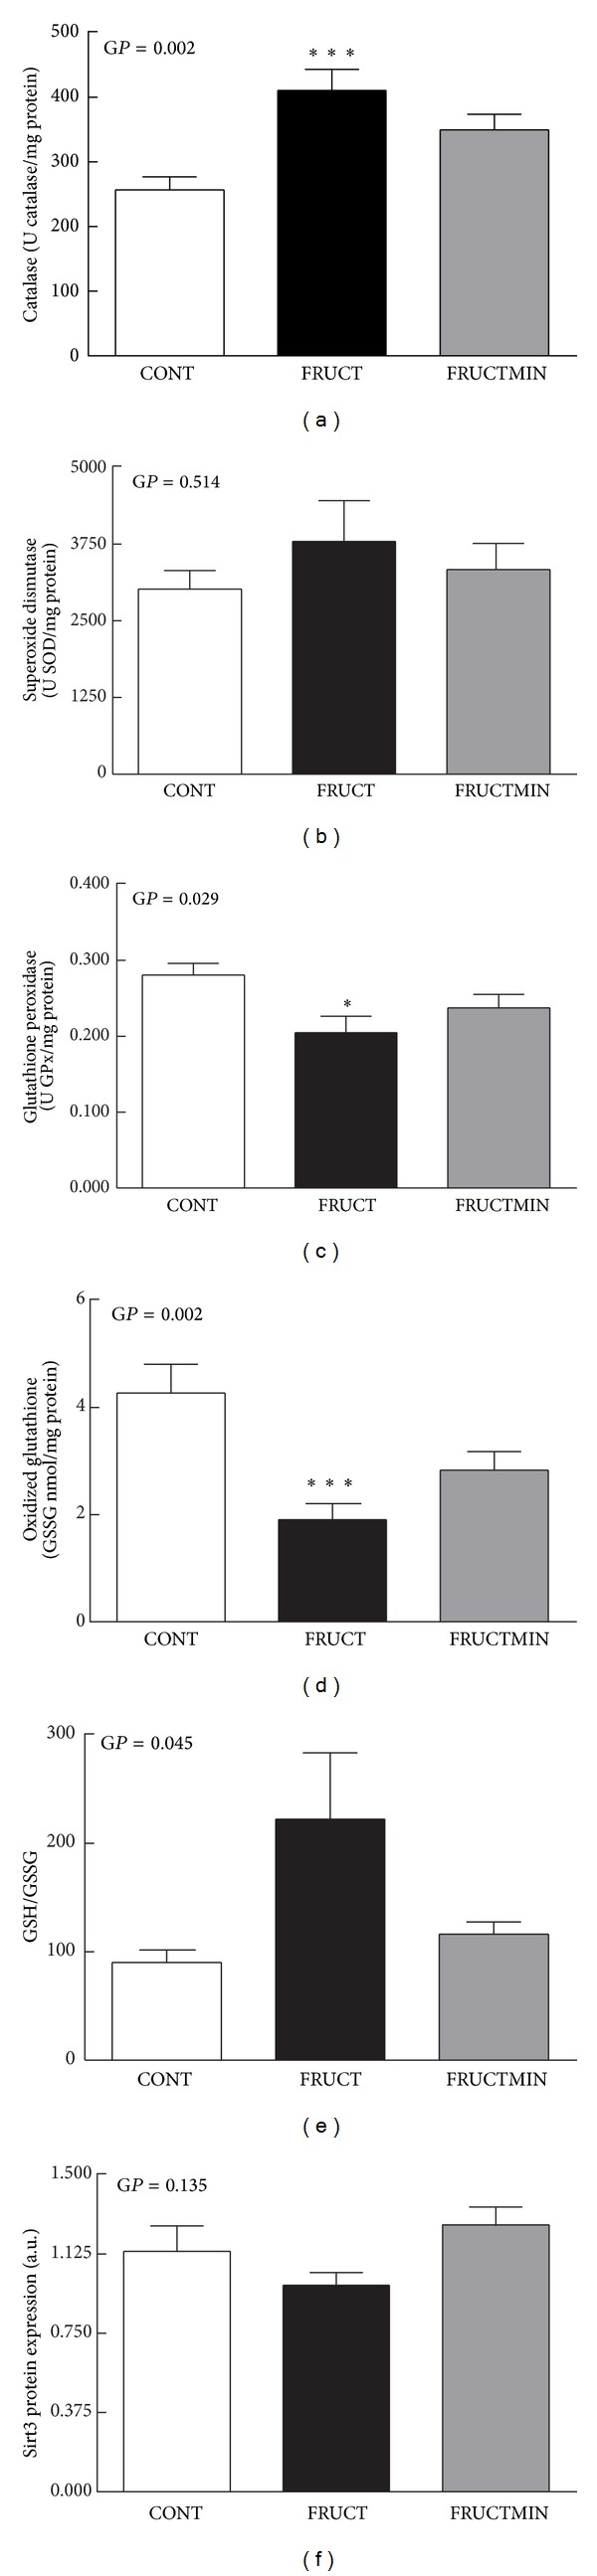
Redox state markers in liver. (a) Catalase (U catalase/mg protein; n = 7), (b) superoxide dismutase (U SOD/mg protein; n = 7), (c) glutathione peroxidase activities (U GPx/mg protein; n = 7), (d) oxidized glutathione content (nmol/mg protein; n = 7), (e) GSH to GSSG ratio (n = 7), and (f) sirtuin 3 protein expression (arbitrary units (a.u.); n = 5-6), at the end of the dietary intervention. Results were expressed as mean ± standard error of the mean. *P < 0.05 CONT versus FRUCT; ***P < 0.005 CONT versus FRUCT. CONT: control; FRUCT: 10% fructose in tap water; FRUCTMIN: 10% fructose in natural mineral-rich water; GP: global P; GPx: glutathione peroxidase; GSH: reduced glutathione; GSSG: oxidized glutathione; Sirt3: sirtuin 3; SOD: superoxide dismutase.