
Figure 8.
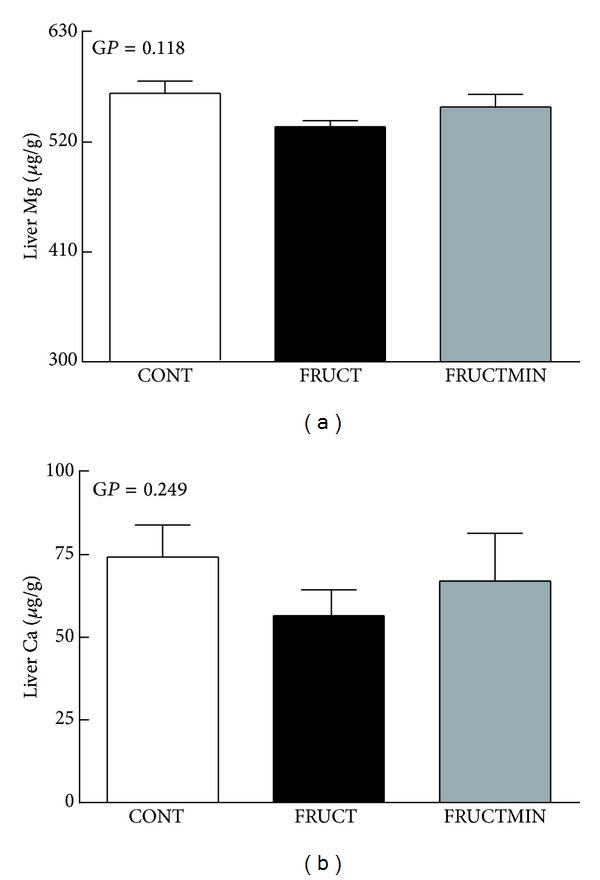
Liver magnesium (a) and calcium (b) content (μg/g of tissue lyophilize; n = 6 for both elements), at the end of the dietary intervention. Results were expressed as mean ± standard error of the mean. Ca: calcium; CONT: control; FRUCT: 10% fructose in tap water; FRUCTMIN: 10% fructose in natural mineral-rich water; GP: global P; Mg: magnesium.