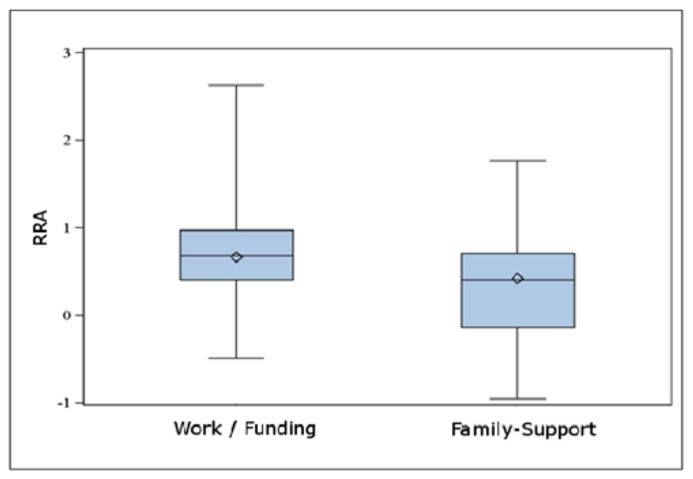
FIGURE 3.
Depicted are the relative risk aversions (RRA) of students in dependence on their source of funding (support by their families vs. other forms of funding, e.g., own work or grants). Using the simple unpaired two-tailed t-test the difference was statistically significant (ΔRRA = 0.22; 95% CI: 0.04–0.41; p = 0.018).

