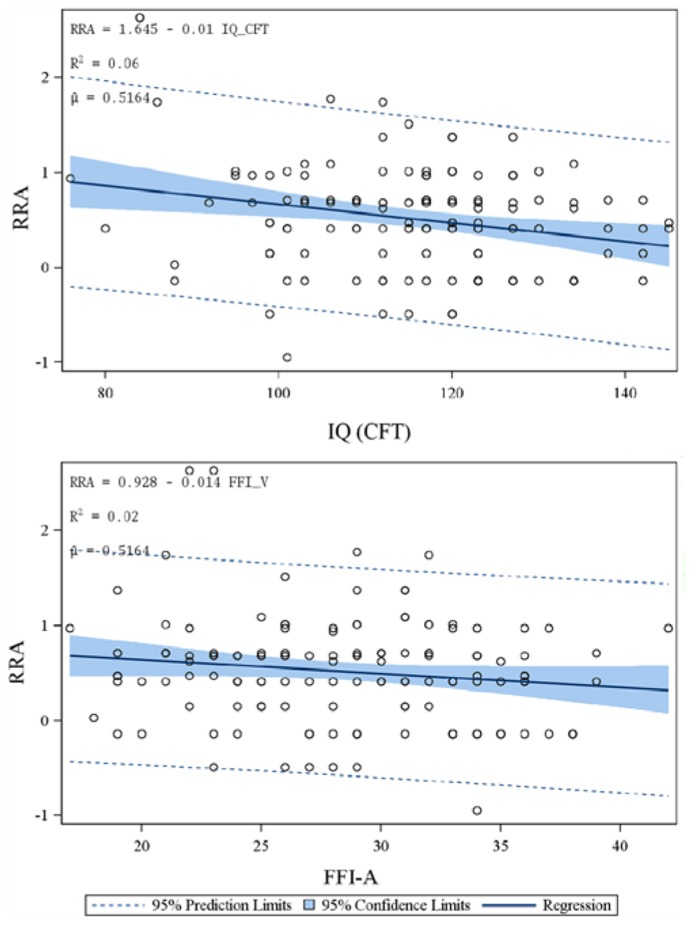
FIGURE 4.
Simple linear regressions after exclusion of six individual datasets according to the check for parameter instability and restricted maximum likelihood effects (proc-mixed, SAS). Depicted are individual observations for RRA plotted versus the intelligence quotient measured by the culture free intelligence task (CFT) and the NEO-FFI agreeableness score (FFI-A). Furthermore, the 95% prediction limits (dotted lines) and the 95% confidence limits (blue area) are depicted.

