Figure 3.
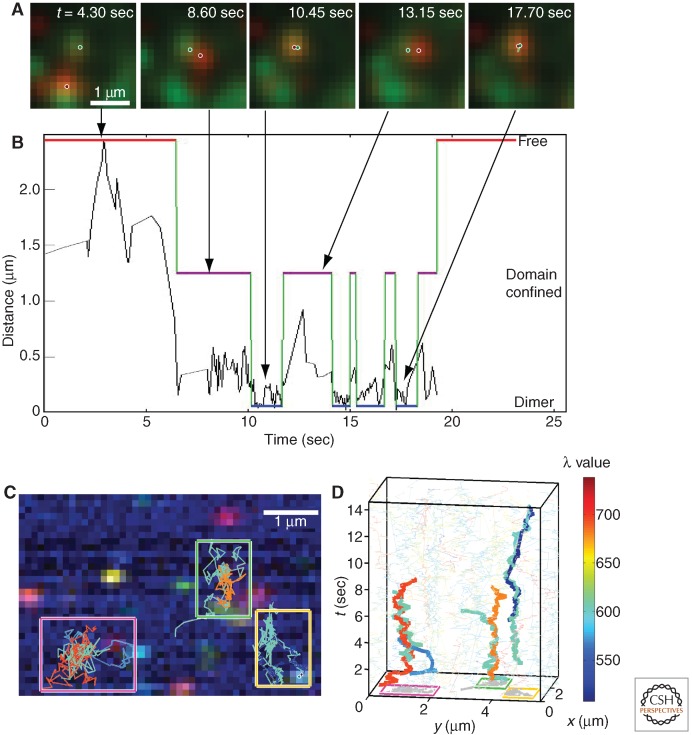
SPT captures dimerization of EGF-bound ErbB1. (A) Images from a time series in which EGF-QD585 (green) and EGF-QD655 (red) are simultaneously tracked. The pixelated image shows the raw data, and the circles indicate the subdiffraction localization of individual receptor molecules. (B) Plot showing the separation over time of the two receptors in (A). Particle trajectories are analyzed using a three-state hidden Markov model based on interparticle distance to distinguish between free (red line), confined (purple line), and dimeric (blue line) receptor populations. In this example, the EGF-bound receptors are seen to undergo repeated (four) dimerization events (see also Low-Nam et al. 2011). (C) Hyperspectral imaging of eight spectrally distinct QDs bound to EGF. Pseudocoloring of the data is generated based on each quantum dot’s (QD) peak spectral wavelength (λ). (D) Three-dimensional particle trajectories (x,y,t) of the corresponding boxed regions in (C). Correlated motion of dimerized receptors can be observed. Color map (right) indicates QD emission peak. (Images from Cutler et al. 2013; reprinted, with permission, from the investigators.)

