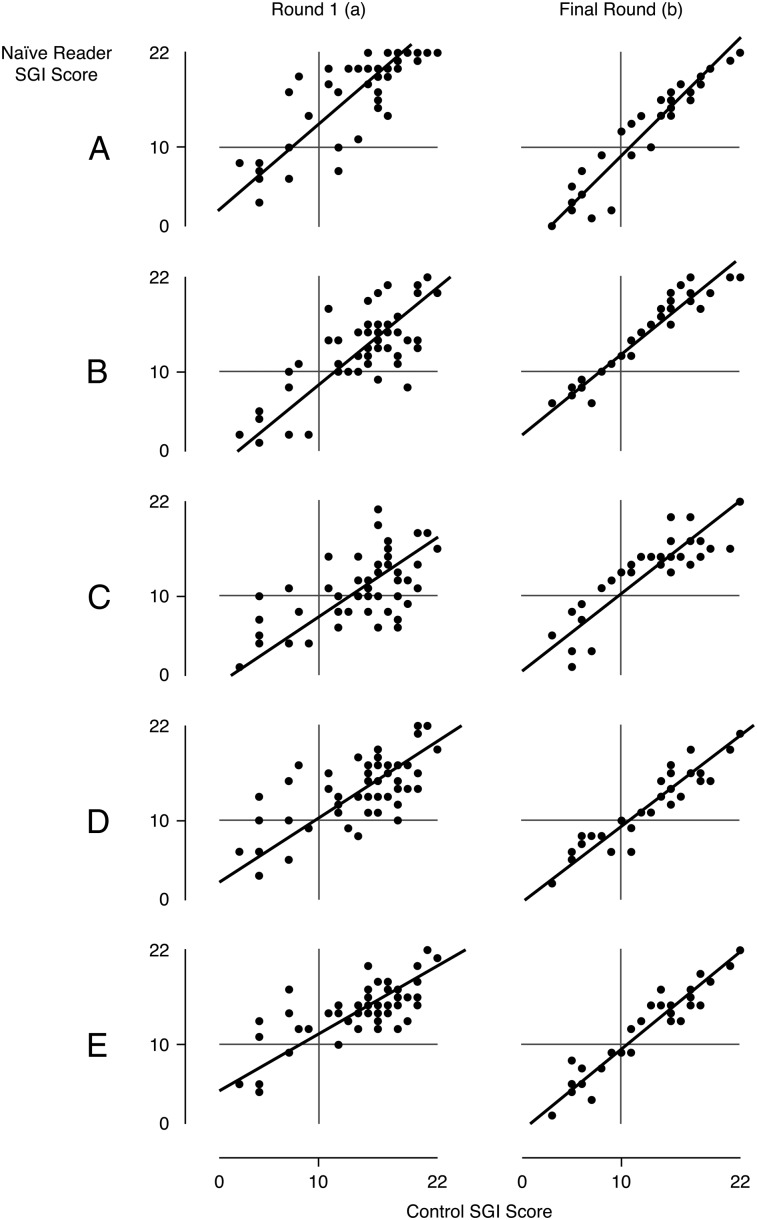
Figure 3.
The vertical axis represents the readers’ SGI scoring, and the horizontal axis represents the control scores. After the first training session there was discordance between readers and control (regression R2 = 51%; range, 35%-65%) (column a). By the final session very good concordance was achieved (regression R2 = 86%; range, 75%-92%) (column b). SGI = supraglottic index.

