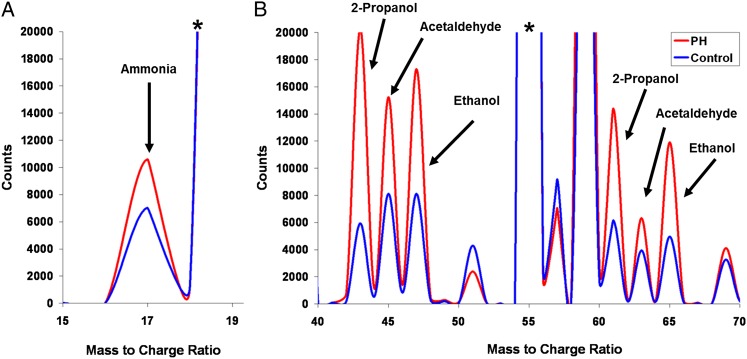
Figure 2.
Representative areas of the average selected ion flow tube-mass spectrometry for the PAH and control groups. Labeled peaks correspond to selected compounds listed in Table 3. A, Ammonia peak comes from the O2+ precursor ion spectrum. B, Other molecules peaks from the H3O+ precursor ion spectrum. The concentrations of a specific compound are calculated based on its counts relative to the precursor counts. *Precursor ion peak. PH = pulmonary hypertension. See Figure 1 legend for expansion of other abbreviation.

