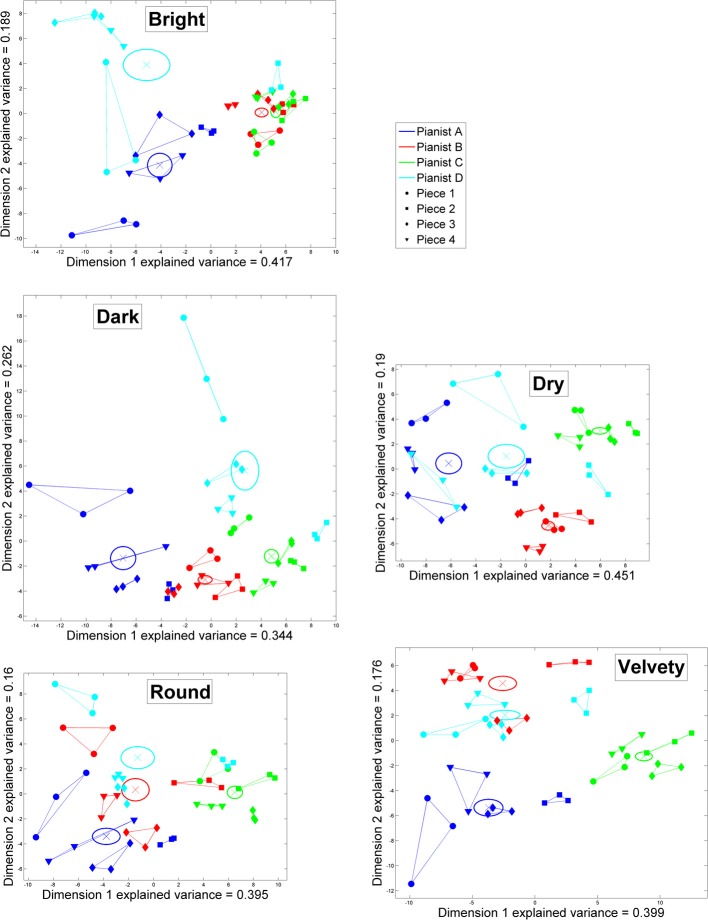
Figure 4.
Principal Component Analysis of the performance features highlighting pianists' individuality over each set of 48 performances corresponding to a different timbral nuance (bright, dark, dry, round, or velvety): two-dimensional reduced performance spaces. In each of the five subplots, the colored lines link the same-piece repeated performances by each pianist. Averages per pianist are indicated by colored crosses, and ±1 SE with ellipses.

