
Figure 2.
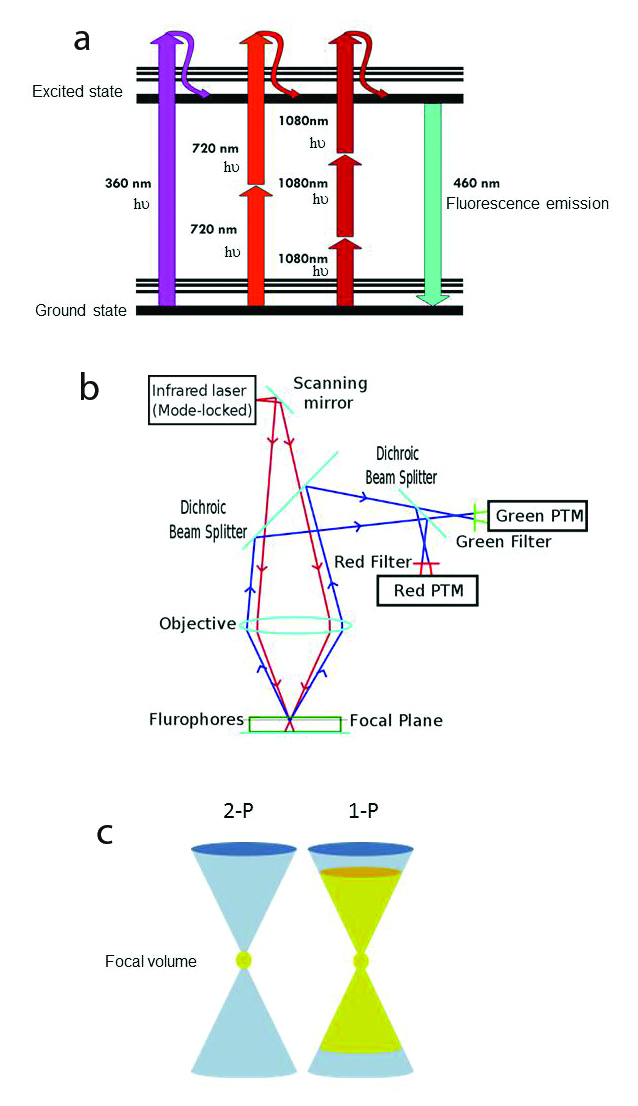
a) Jablonski fluorescence diagram showing excitation of atoms with 1PE: 360 nm (magenta), 2PE: 720 nm light (scarlet red) and 3PE: 1080 nm light (burgundy red. The thicker lines represent electronic energy levels, while the thinner lines indicate various vibrational energy states in the ground (lower) and excited (upper) states. In each case, the resulting fluorescence emission is 460 nm (cyan) visible light. © Wikimedia Commons/Alberto Diaspro, Paolo Bianchini, Giuseppe Vicidomini, Mario Faretta, Paola Ramoino and Cesare Usai. b) Scheme of 2-photon excitation microscopy. Incident excitation pulsed laser light (red). Fluorescence emission (blue). Photomultiplier tube (PTM). © Wikimedia Commons. c) Schematic illustration of the difference between 1- and 2-photon absorption. 2-photon absorption occurs only in the small focal volume (yellow) defined by the wavelength and NA of the objective. On the right, 1-photon excitation (yellow) by out-of-focus photons occurs above and below the focal plane, causing unnecessary photodamage to the sample. From: Magnus B. Lilledahl, Gary Chinga-Carrasco and Catharina de Lange Davies. Three-Dimensional Visualization and Quantification of Structural Fibres for Biomedical Applications. Available from: http://www.intechopen.com/books/confocal-laser-microscopy-principles-and-applications-in-medicine-biology-and-the-food-sciences/three-dimensional-visualization-and-quantification-of-structural-fibres-for-biomedical-applications.