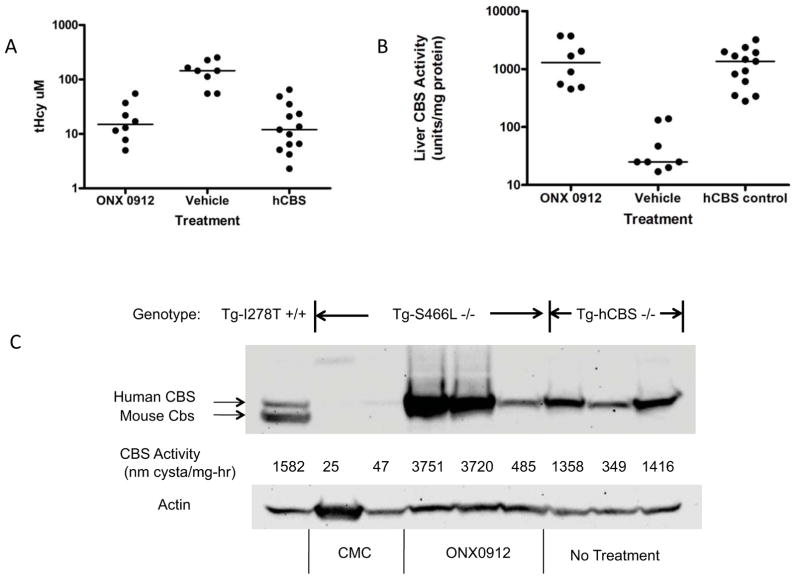
Figure 1.
ONX 0912 rescue of S466L CBS. A: Graph of tHcy in Tg-S466L Cbs−/− treated with ONX 0912 or vehicle. The column labeled “hCBS” shows values from either untreated or vehicle treated Tg-hCBS Cbs−/− animals. For each column, the dots show individual animals. The line indicates the median. B: Graph of CBS activity in liver extracts from ONX 0912, vehicle, and Tg-hCBS Cbs−/− control mice. C: Western blot of liver extracts in Tg-S466L Cbs−/− mice treated with either vehicle (CMC; carboxymethyl cellulose) or ONX 0912. Also included are extracts from untreated Tg-hCBS Cbs−/− animals (right three lanes), and a control extract from a Tg-I278T Cbs+/− animal. For each lane, CBS activity is also indicated. CMC indicates animals treated with vehicle only.

