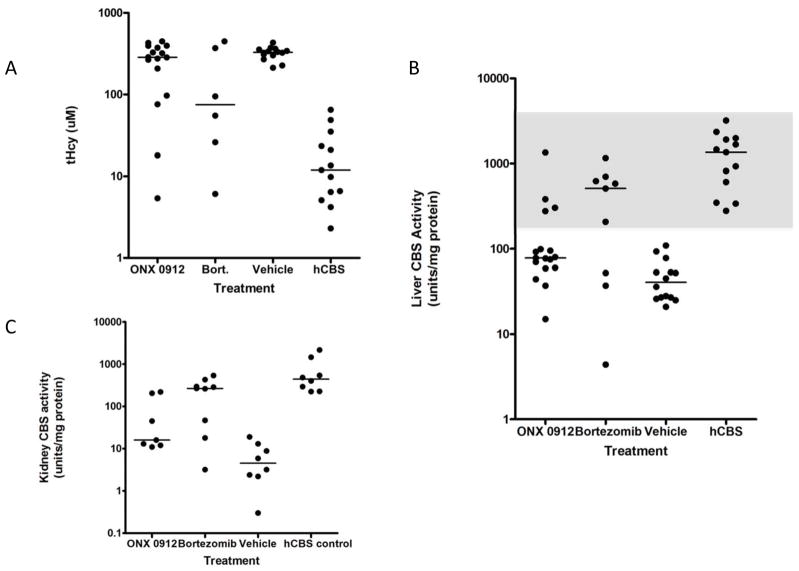
Figure 2.
ONX 0912 and bortezomib rescue of I278T CBS. A: Graph of tHcy in Tg-I278T Cbs−/− mice treated with ONX 0912, bortezomib, or vehicle (Saline and CMC combined). The column labeled “hCBS” shows values from Tg-hCBS Cbs−/− animals. For each column, the dots show individual animals. Median values are also shown. B: Graph of CBS activity in liver extracts from Tg-I278T Cbs−/− mice treated with ONX 0912, bortezomib, or vehicle. Gray region shows a box identifying responders. C: Graph of CBS activity in kidney extracts from Tg-I278T Cbs−/− mice treated with ONX 0912, bortezomib, or vehicle.

