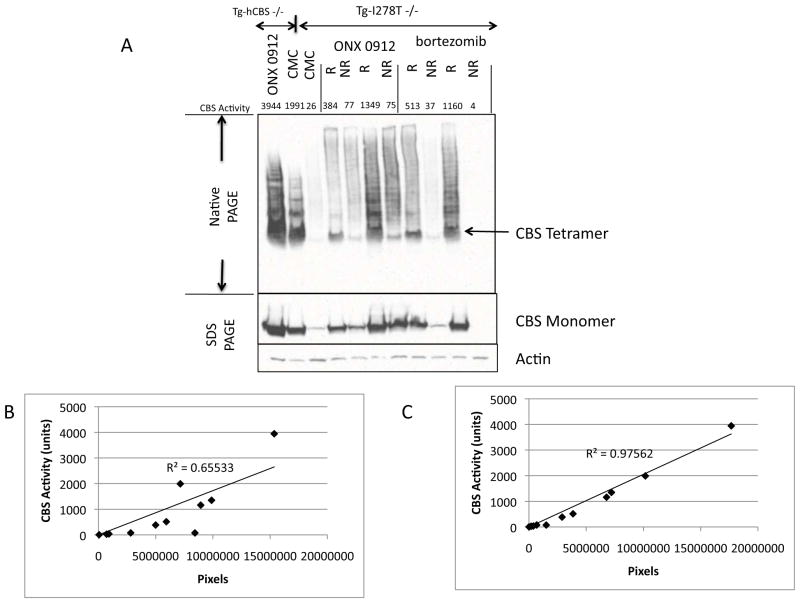
Figure 3.
Steady state CBS levels in ONX 0912- and bortezomib-treated mice. A: Native and denaturing gel Western blot analyses showing CBS levels in ONX 0912- and bortezomib-treated mice. Liver CBS enzyme activity level for the extract is shown above. Controls on left two lanes are Tg-hCBS Cbs−/− mice treated with ONX 0912 or Vehicle (CMC). R and NR stand for responder and non-responder. In Native gels, bands above the tetramer represent higher molecular weight CBS containing complexes. B: Plot of amount of CBS protein as determined by densitometry of the denaturing gel vs. CBS activity. C: Plot of amount of CBS protein as determined by densitometry of the native gel vs. CBS activity.

