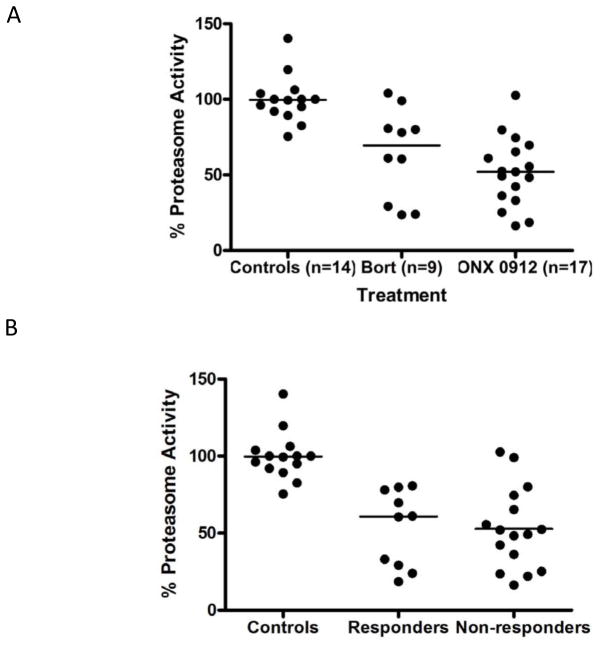
Figure 4.
Inhibition of proteasome activity. A: Proteasome activity measured in liver extracts from mice treated with the indicated drugs. Activity is expressed as a % of the average of the control (vehicle-treated) animals. Line indicates median. B: Proteasome activity in Responders and Non-responders.

