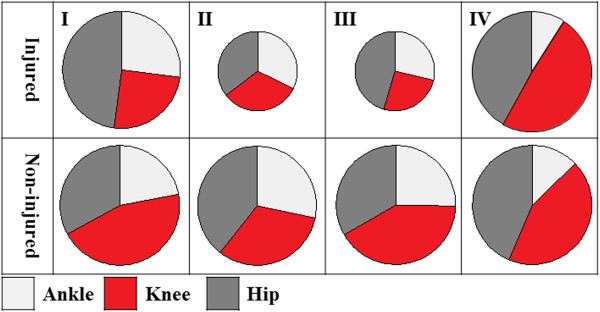
Figure 2.

Double leg squat compensation strategies (graphical representation). The slices represent the percentage of support moment produced by the ankle (light grey), knee (red) and hip (dark grey). The sizes of the circles refer to the magnitude of the total support moment; the same size on the injured and non-injured side (I and IV) indicates an even distribution between the legs, while a smaller size circle on the injured side (II and III) indicates a reduced support moment in the injured leg. The strategies I-IV therefore represent the following: I) similar support moment in the injured and non-injured leg but reduced contribution of the knee in the injured leg (some ACLD individuals and ACLR), II) reduced support moment in the injured leg but similar contribution of the knee to the support moment in the injured and non-injured leg (some ACLD individuals and ACLR), III) reduced support moment and reduced contribution of the knee in the injured compared to the non-injured leg (some ACLD individuals only), IV) similar support moment and similar contribution of the knee in the injured and non-injured legs (some ACLD and some ACLR individuals and CONT).
