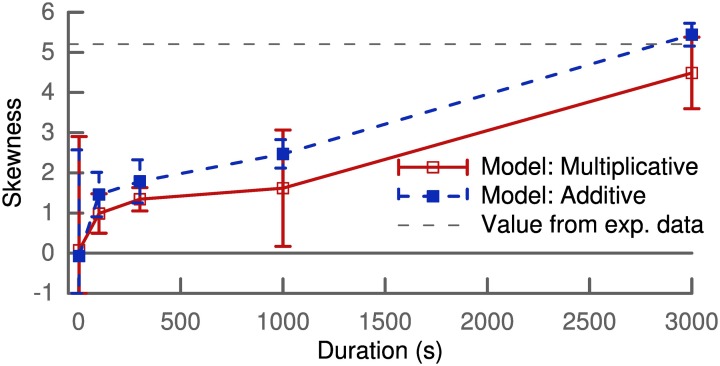
Figure 2.
Skewness of the synaptic weight distribution over simulation duration. The horizontal dashed lines correspond to the value calculated from a lognormal fit to experimental data (Song et al., 2005). Results shown are calculated for one population of 100 synapses with the mean and variance of skewness averaged over several trials.

