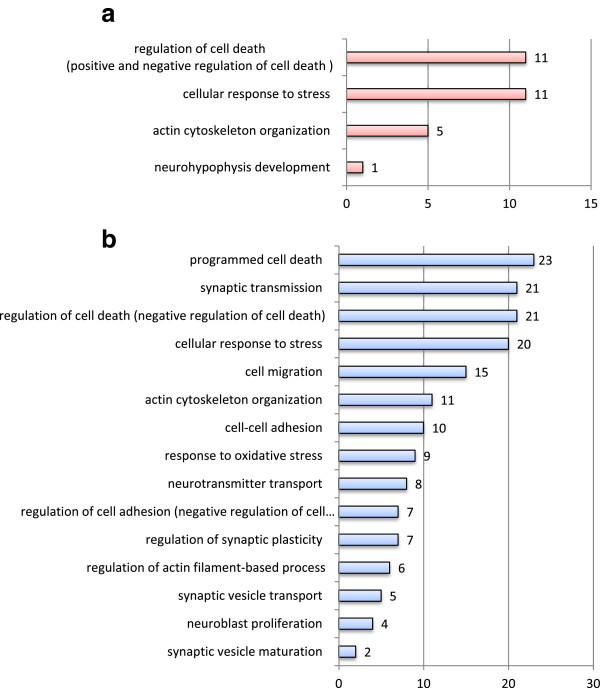
Figure 3.
Distribution of differentially expressed genes according to GO BP in (a) HR and (b) LR rats. GeneCodis functional GO BP level 5 categories that meet conservative statistical criteria (hypergeometric distribution and false discovery rate (FDR) test, p < 0.05) and include any one of the selected relevant keywords (i.e., neuro-, synaptic, stress, plasticity, death, cytoskeleton, migration, and adhesion). Numbers in the chart denote the number of genes grouped in each annotation.

