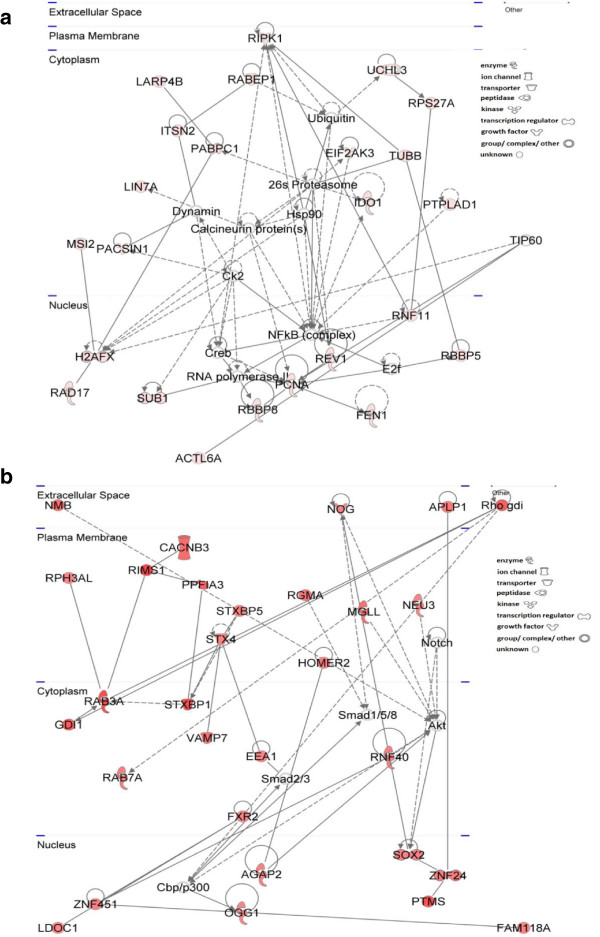
Figure 4.
Top Ingenuity networks of genes whose expression was significantly altered in the hippocampus upon FST exposure. (a) HR (24 upregulated transcripts) and (b) LR (30 upregulated transcripts) rats. Upregulated molecules are shown in red and increasing color intensity reflects higher fold changes. Genes with baseline expression are shown in white. Arrows point to the activated molecule in a signaling pathway or the product of a metabolic pathway. Solid lines indicate direct and dashed lines indirect interactions. Geometrical shapes (nodes) reflect the key functions of the specific protein.

