Figure 3.
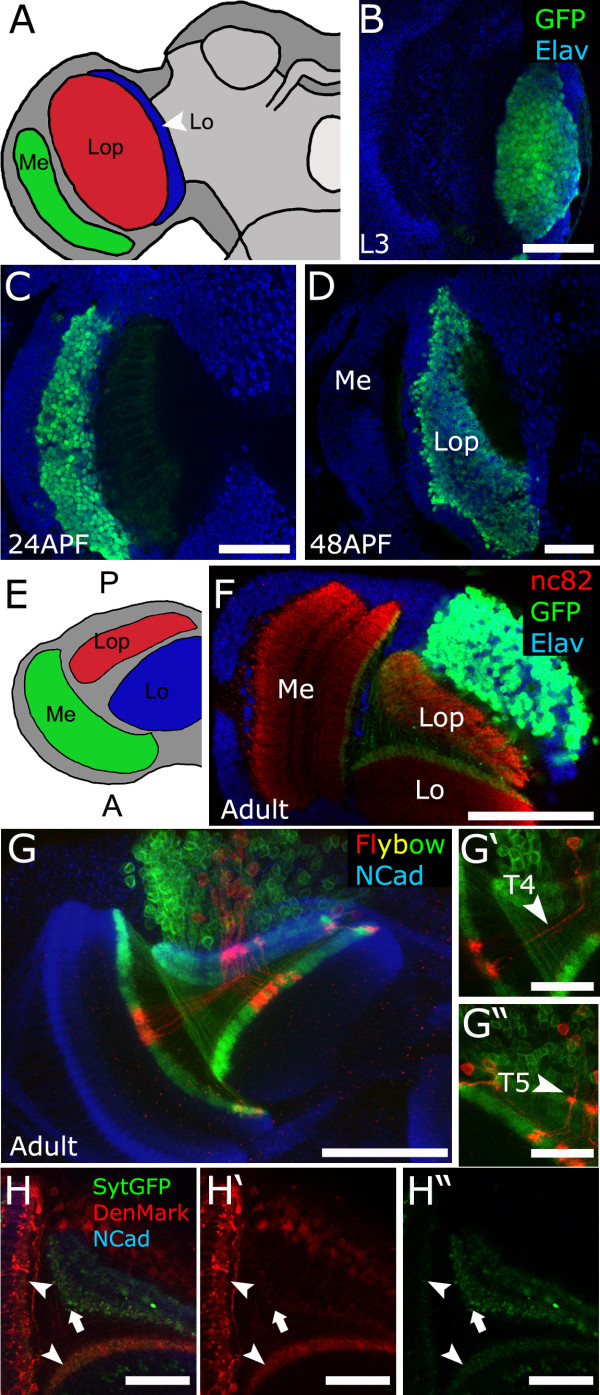
Ato+ progenitors give rise to T4 and T5 lobula plate neurons. (A) Components of the fly optic lobe (posterior view). (B-F) Animals bearing IPC-Gal4, UAS-nEGFP were used to visualize the progeny of Ato+ cells in different stages of development (green). Elav was used to highlight neurons. (B) L3, (C) 24hAPF, (D) 48hAPF. (E) Horizontal view of the brain. (F) Immunostaining in adult stage (horizontal section) showing the pattern of T4/T5 neurons. This population of neurons is localized at the rear of the Lop (at the top of the panel). (G) Immunostaining of optical horizontal sections of the optic lobe of adult brains of flies bearing transgenes for the flybow technique. Flip-out and inversions events of the flybow 2.0 cassette were visualized with anti-GFP (green) and anti-DsRed (red) antibodies. NCad (blue) was used as general neuropile marker. (G',G'') High magnification images of single neurons. Arrowheads indicate single T4 and T5 neurons. (H,H',H'') Adult brains (horizontal section) expressing UAS-Denmark (red) and UAS-Synaptotagmin-GFP (UAS-SytGFP, green) driven by IPC-Gal4. Denmark is enriched in the proximal Lo and proximal Me (arrowheads) while SytGFP is enriched in the Lop neuropile (arrow). Scale bars: B-D, F = 50 μm, G = 50 μm, G’-G'' = 25 μm, H-H'' = 25 μm. A, anterior; L3, third instar larvae; Lo, lobula; Lop, lobula plate; Me, medulla; P, posterior.

