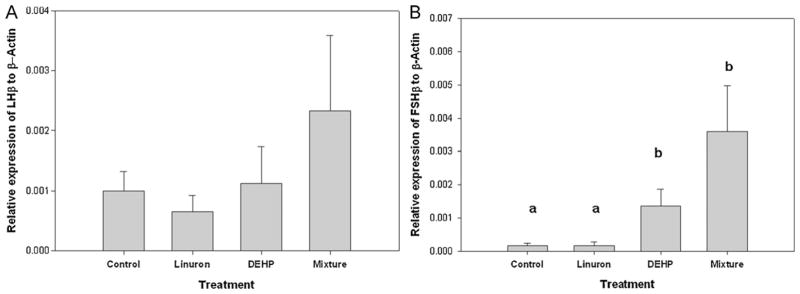
Fig. 3.

Relative mRNA transcripts expression of (A) LHβ and (B) FSHβ mRNA transcripts in brain of male FHM exposed to the control, linuron, DEHP, or the mixture. Error bars represent ± SEM. N = control: 10, linuron: 8, DEHP: 9, mixture: 8. ANOVA: p < 0.001, Tukey DEHP vs. control: p = 0.017, DEHP vs. linuron: p = 0.005, mixture vs. control: p = 0.001; mixture vs. linuron: p < 0.001.
