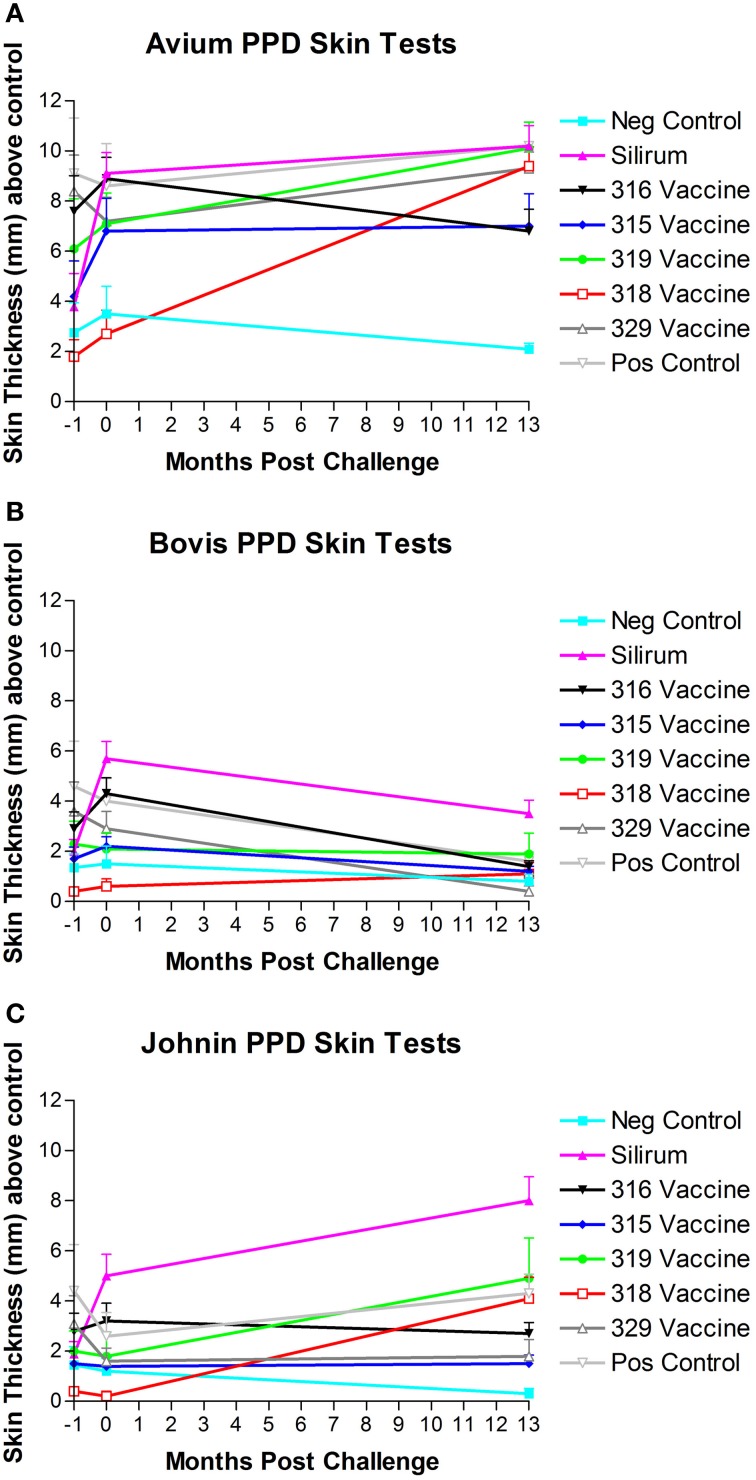
Figure 7.
(A–C) PPD skin test results over time. Note the strong skin responses to M. avium (A) and Johnin (C) PPD in multiple groups, and the generally lower responses to M. bovis (B) PPD with the exception of the Silirum® and 316 vaccines. (Error bars represent standard error of the mean, −1 is baseline bleeding, 0 is challenge date and 1–13 represents months post-challenge).

